tkz-grapheur package example
📅 13 November 2026 👁️ المشاهدات: 1
📄 ماذا ستجد في هذه الصفحة؟
• ملف الدرس بصيغة PDF يمكنك معاينته هنا مباشرةً دون تنزيله.
• يمكنك تنزيل الملف من زر التحميل أسفل الصفحة والاحتفاظ به على جهازك.
• ستجد أيضًا دروسًا وامتحانات وتمارين ذات صلة تساعدك على المراجعة وتعميق الفهم.
• أُدرج مصدر LaTeX الكامل أسفل الصفحة لتتمكن من الاطلاع عليه أو تعديله والاستفادة منه.
• هل تحتاج تنسيقًا احترافيًا لموادك الخاصة؟ أقدم خدمة كتابة LaTeX — أرسل المحتوى المطلوب لتحصل على ملف PDF منسق وملف المصدر.
\documentclass[border=10pt, convert={density=300,outext=.png}]{standalone}
\usepackage{tkz-grapheur}
\pgfplotsset{compat=1.18}
\begin{document}
% =====================================================================
%  ENVIRONMENT: GraphTikz
% ---------------------------------------------------------------------
%  The GraphTikz environment is the core of tkz-grapheur.  It creates
%  a TikZ picture whose coordinate system is driven by the keys
%  Xmin, Xmax, Ymin, Ymax (and optionally the unit lengths x, y).
%  Inside this environment you can use all standard TikZ commands
%  *and* the specialised grapheur commands.
% =====================================================================
\begin{GraphTikz}[x=1.5cm,y=1.5cm,Xmin=-1,Xmax=5,Ymin=-1,Ymax=3]

  % -------------------------------------------------------------------
  %  \DrawAxisGrids
  %  Draws the grid, the axes and the graduations.
  %  Syntax: \DrawAxisGrids[keys]{gradX}{gradY}
  %  - The optional [keys] control the appearance:
  %      Enlarge=...   adds a little extra length at the end of the axes
  %      Grads=false  suppress graduations
  %      Grid=false   suppress the grid
  %      Font=...     font used for the labels
  %      Format=...   special formatting (e.g. fractions, years, …)
  %  - The two mandatory arguments are the lists of values for the
  %    x-axis and the y-axis.  Here “auto” lets the package choose
  %    reasonable step sizes automatically.
  % -------------------------------------------------------------------
  \DrawAxisGrids[Enlarge=2.5mm]{auto}{auto}

  % -------------------------------------------------------------------
  %  \DefineCurve
  %  Defines a function and (optionally) traces its graph.
  %  Syntax: \DefineCurve[keys]{formula}
  %  Important keys:
  %    Name=...     a name for the curve (used later to refer to it)
  %    Start=...    lower bound of the domain (default: Xmin)
  %    End=...      upper bound of the domain (default: Xmax)
  %    Trace        if present, the curve is drawn immediately
  %    TraceStyle=... style applied to the drawing (e.g. very thick)
  %  The formula is written in the syntax of the xint package
  %  (standard mathematical notation such as cos, sin, log, etc.).
  % -------------------------------------------------------------------
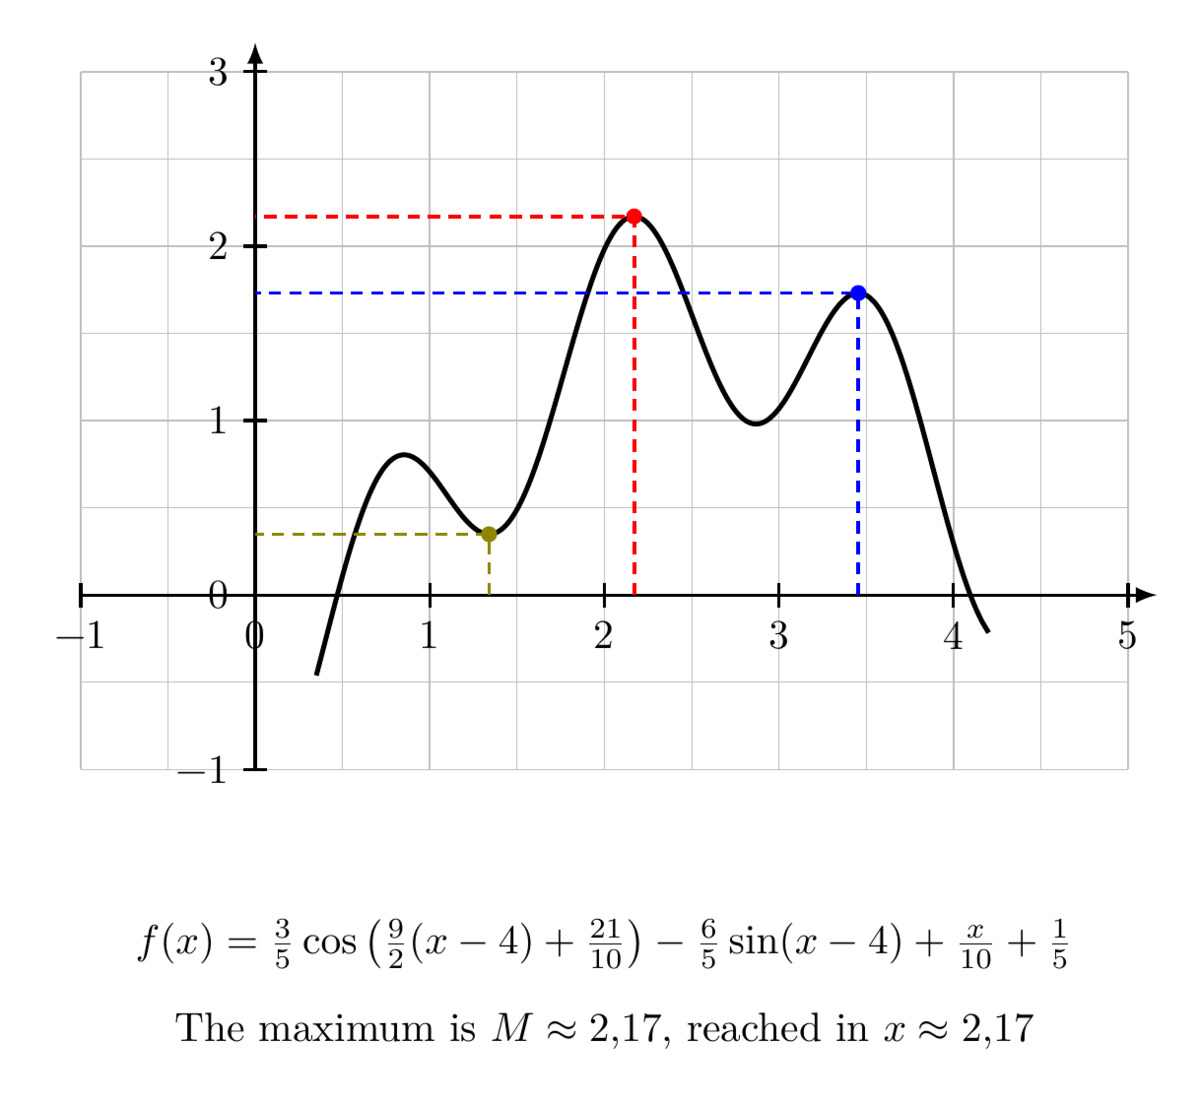
  \DefineCurve[Name=cf,Start=0.35,End=4.2,Trace,TraceStyle={very thick}]%
  <f>{0.6*cos(4.5*(x-4)+2.1)-1.2*sin(x-4)+0.1*x+0.2}

  % -------------------------------------------------------------------
  %  \FindMax  (global maximum)
  %  Syntax: \FindMax[Start=...,End=...]{curve}[node created]
  %  Searches for the maximum of the curve “f” on the given interval
  %  and stores the result in a TikZ node whose name is given in the
  %  last argument (here cf-max).  The x- and y-coordinates of that
  %  node can later be retrieved with \GetXYcoord.
  % -------------------------------------------------------------------
  \FindMax[Start=0.35,End=4.2]{f}[cf-max]

  % -------------------------------------------------------------------
  %  \FindMax  (local maximum)
  %  Same as above, but restricted to a sub-interval (here [3,4]).
  %  The result is stored in the node cf-maxlocal.
  % -------------------------------------------------------------------
  \FindMax[Start=3,End=4]{f}[cf-maxlocal]

  % -------------------------------------------------------------------
  %  \FindMin  (local minimum)
  %  Syntax: \FindMin[Start=...,End=...]{curve}[node created]
  %  Finds the minimum on [1,2] and stores it in cf-minlocal.
  % -------------------------------------------------------------------
  \FindMin[Start=1,End=2]{f}[cf-minlocal]

  % -------------------------------------------------------------------
  %  \MarkPts*
  %  Marks points on the graph.
  %  Syntax: \MarkPts*[keys]{list of nodes}
  %  The starred version shows only the mark (no label).
  %  Keys:
  %    Color=...    colour of the mark
  %    Lines        draws thin guide lines from the mark to the axes
  %    Style=...    shape of the mark (x, +, c, d, …)
  %  The list contains the names of the nodes created by
  %  \FindMax or \FindMin.
  % -------------------------------------------------------------------
  \MarkPts*[Color=red,Lines]{(cf-max)}
  \MarkPts*[Color=blue,Lines]{(cf-maxlocal)}
  \MarkPts*[Color=olive,Lines]{(cf-minlocal)}

  % -------------------------------------------------------------------
  %  \GetXYcoord
  %  Retrieves the coordinates of a previously defined node.
  %  Syntax: \GetXYcoord{node}[\macroX][\macroY]
  %  The x-coordinate is stored in \macroX, the y-coordinate in \macroY.
  %  These macros can then be used in the text (or elsewhere).
  % -------------------------------------------------------------------
  \GetXYcoord{(cf-max)}[\MyMaxX][\MyMaxY]

  \node at (2,-2) {$f(x)=\frac{3}{5}\cos\left(\frac{9}{2}(x-4)+\frac{21}{10}\right) -\frac{6}{5}\sin(x-4) +\frac{x}{10}+\frac{1}{5} $};
  \node at (2,-2.5) {The maximum is \(M\approx\RoundNb{\MyMaxY}\), reached in \(x\approx\RoundNb{\MyMaxX}\)};

\end{GraphTikz}
% The macros \MyMaxX and \MyMaxY now hold the coordinates of the
% global maximum.  \RoundNb is a helper provided by tkz-grapheur
% that rounds a number to a sensible precision.
\end{document}
موارد ذات صلة: دروس وامتحانات وتمارين
📄 هل تحتاج تنسيقًا بـ LaTeX؟
أرسل لي واجبك أو امتحانك أو تمارينك وسأحوّلها إلى ملف PDF احترافي.
اعرف المزيد ←أحدث الدروس
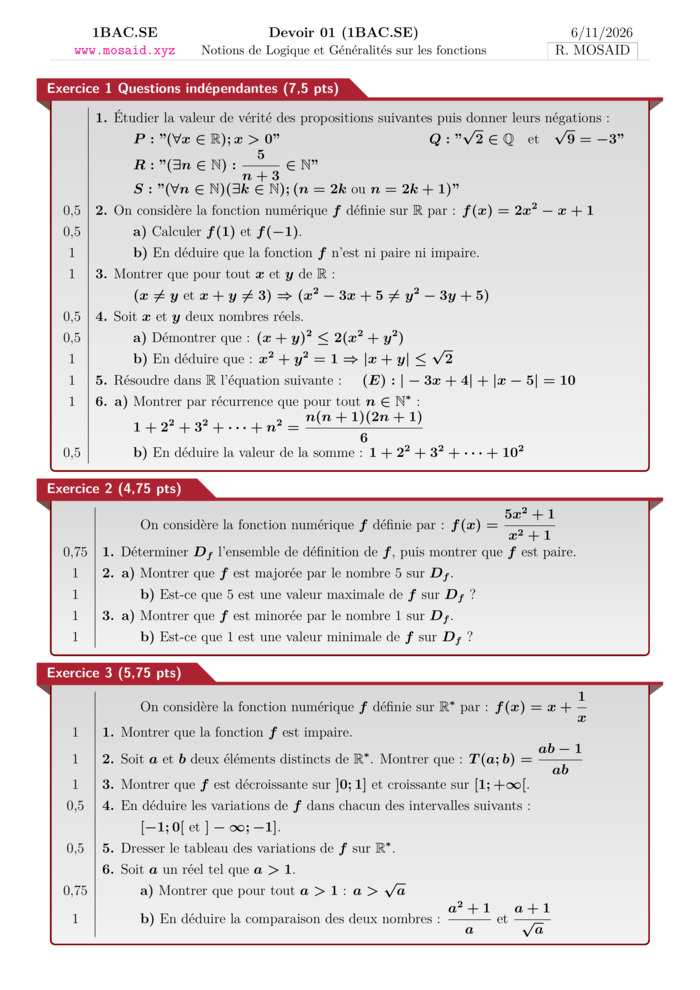
Devoir 01 (1BAC.SE) -- Notions de Logique et Généralités sur les fonctions
06 Nov 2026 • 184 views
امتحان • Maths • 1 Bac Science
الأكثر مشاهدة
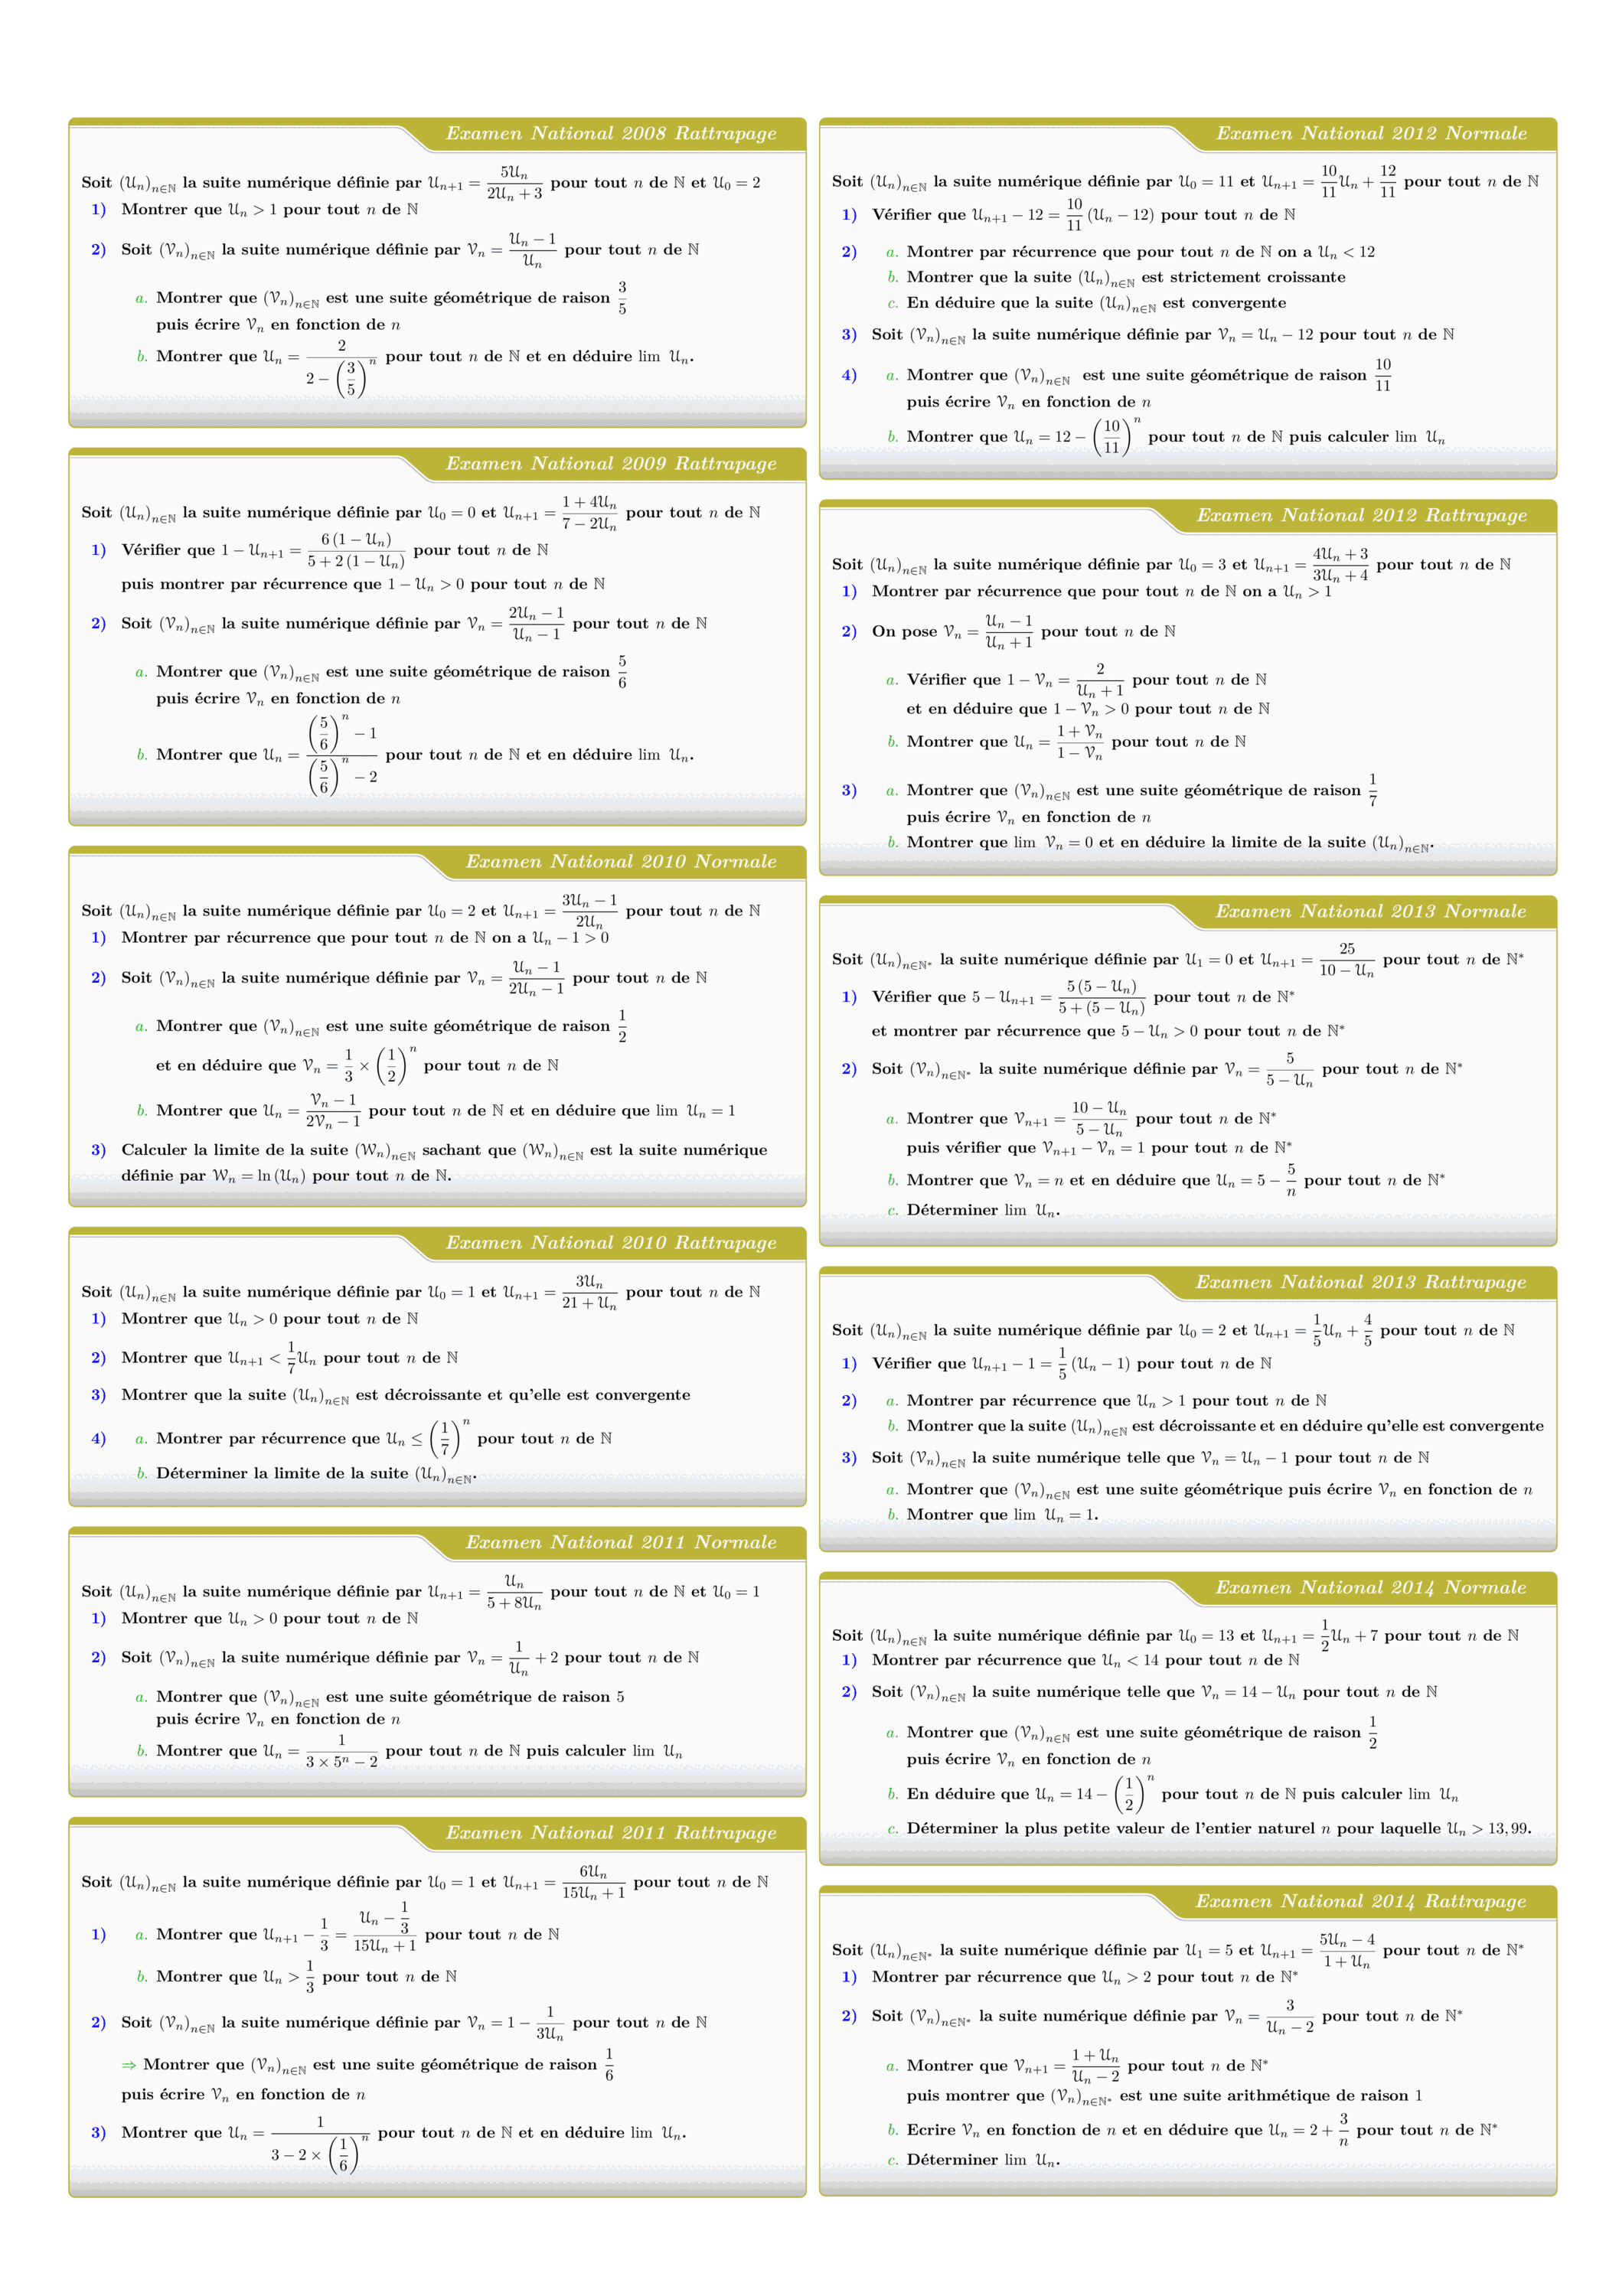
Tous les sujets des suites numériques des examens nationaux 2008 - 2022
views: 3.16K
امتحان • Maths • 2 Bac Science

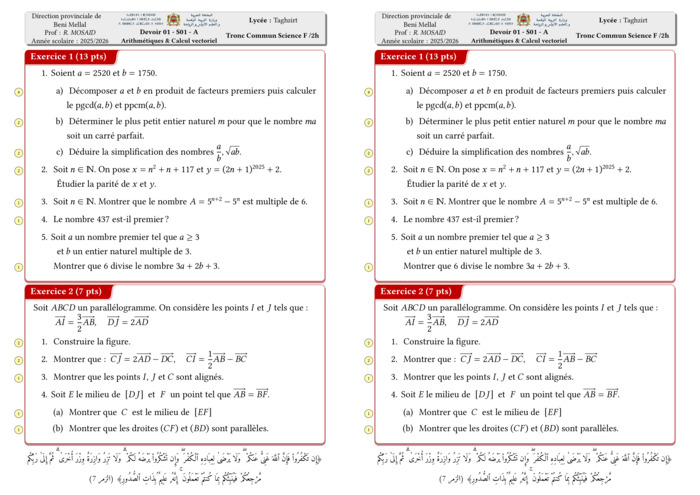
Control 01 S01 En arithmétiques et Calcul vectoriel - A 2025-2026
views: 2.17K
امتحان • Maths • Tronc Commun Sciences
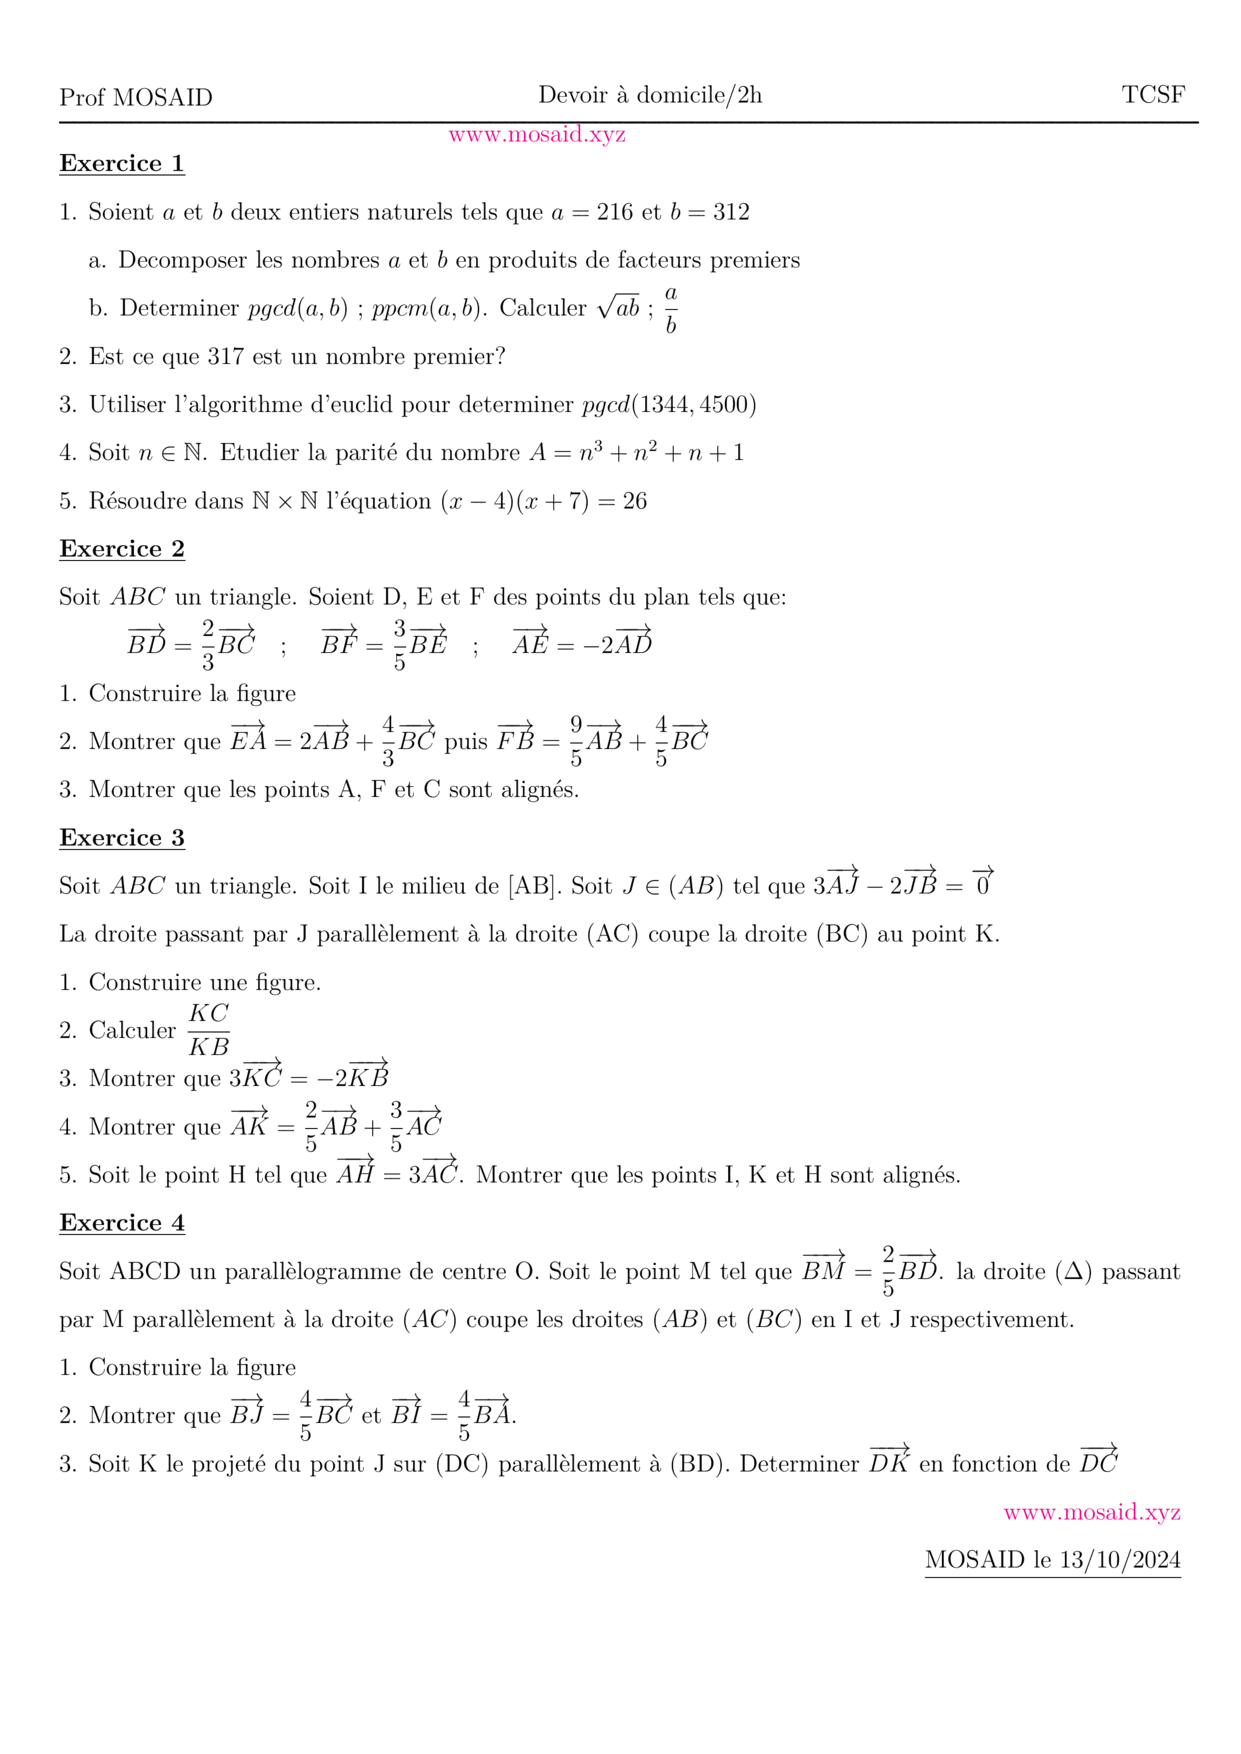
DM 1 - Arithmetiques, Calcul vectoriel et projection
views: 2.00K
امتحان • Maths • Tronc Commun Sciences
MATHEMATIQUES Examens nationaux 2003-2021 2 Bac.Sciences expérimentales
views: 1.99K
امتحان • Maths • 2 Bac Science
Recent Articles



Most Viewed Articles



The Ultimate Vim Setup (My 2024 vimrc ) : Essential Commands, Configurations, and Plugin Tips
Views: 1.49K
12 Apr 2024
Complete Tutorial: Creating Categories and Subcategories Using Pages in Pelican
Views: 1.14K
24 Jun 2025
اترك تعليقًا