Courbe d'une fonction périodique paire - clip - axis line dashed
📅 17 April 2024 👁️ المشاهدات: 125
📄 ماذا ستجد في هذه الصفحة؟
• ملف الدرس بصيغة PDF يمكنك معاينته هنا مباشرةً دون تنزيله.
• يمكنك تنزيل الملف من زر التحميل أسفل الصفحة والاحتفاظ به على جهازك.
• ستجد أيضًا دروسًا وامتحانات وتمارين ذات صلة تساعدك على المراجعة وتعميق الفهم.
• أُدرج مصدر LaTeX الكامل أسفل الصفحة لتتمكن من الاطلاع عليه أو تعديله والاستفادة منه.
• هل تحتاج تنسيقًا احترافيًا لموادك الخاصة؟ أقدم خدمة كتابة LaTeX — أرسل المحتوى المطلوب لتحصل على ملف PDF منسق وملف المصدر.

\documentclass{standalone}
\standaloneconfig{margin=2mm 2mm 2mm 2mm}
\usepackage{pgfplots}
\pgfplotsset{compat=newest}

\begin{document}

\begin{tikzpicture}[scale=1.00]
    \begin{axis}[axis lines=center,
        xlabel={$x$},
        ylabel={$y$},
        xtick=\empty,ytick=\empty,
    xmin=-2.5,xmax=2.5,
    ymin=-0.1,ymax=1,
    axis line style={dashed},
        samples=200]
     \begin{scope}
            \clip (-2.2,-0.1) rectangle (2.2,1); % Define clipping path
            \draw[red, thick,looseness=0.4]
               (-2.5,1) to[out=0,in=180] (-2,0)
                        to[out=0,in=180] (-1,0.60)
                        to[out=0,in=180] (0,0)
                        to[out=0,in=180] (1,0.60)
                        to[out=0,in=180] (2,0)
                        to[out=0,in=180] (2.5,0.5); % Original curve path
      \end{scope}
      \node[below] at (2,0) {$e$};
      \node[below] at (-2,0) {$-e$};
      \node[below left] at (0,0) {\tiny O};
     \end{axis}
     \node[above] at (3.5,-0.5) {fonction périodique paire};
\end{tikzpicture}
\end{document}
\documentclass{standalone}
\standaloneconfig{margin=2mm 2mm 2mm 2mm}
\usepackage{pgfplots}
\pgfplotsset{compat=newest}

\begin{document}

\begin{tikzpicture}[scale=1.00]
    \begin{axis}[axis lines=center,
        xlabel={$x$},
        ylabel={$y$},
        xtick=\empty,ytick=\empty,
    xmin=-2.5,xmax=2.5,
    ymin=-0.1,ymax=1,
    axis line style={dashed},
        samples=200]
     \begin{scope}
            \clip (-2.2,-0.1) rectangle (2.2,1); % Define clipping path
            \draw[red, thick,looseness=0.4]
               (-2.5,1) to[out=0,in=180] (-2,0)
                        to[out=0,in=180] (-1,0.60)
                        to[out=0,in=180] (0,0)
                        to[out=0,in=180] (1,0.60)
                        to[out=0,in=180] (2,0)
                        to[out=0,in=180] (2.5,0.5); % Original curve path
      \end{scope}
      \node[below] at (2,0) {$e$};
      \node[below] at (-2,0) {$-e$};
      \node[below left] at (0,0) {\tiny O};
     \end{axis}
     \node[above] at (3.5,-0.5) {fonction périodique paire};
\end{tikzpicture}
\end{document}
موارد ذات صلة: دروس وامتحانات وتمارين
📄 هل تحتاج تنسيقًا بـ LaTeX؟
أرسل لي واجبك أو امتحانك أو تمارينك وسأحوّلها إلى ملف PDF احترافي.
اعرف المزيد ←أحدث الدروس
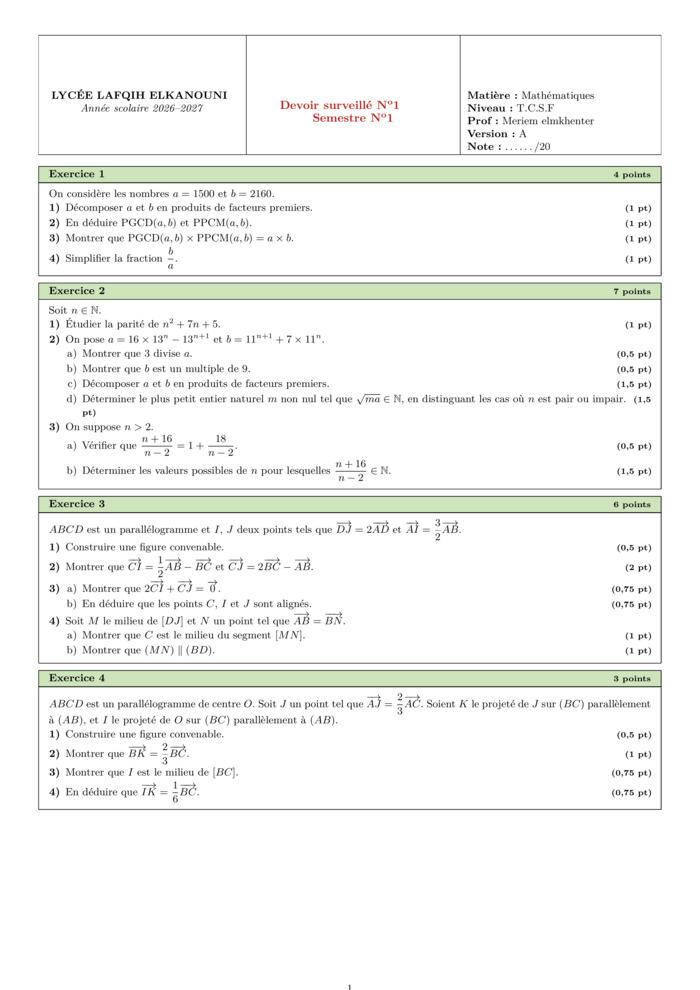
Devoir 01S01 ABCD PAR Meriem elmkhenter
04 Nov 2026 • 1 views
امتحان • Maths • Tronc Commun Sciences
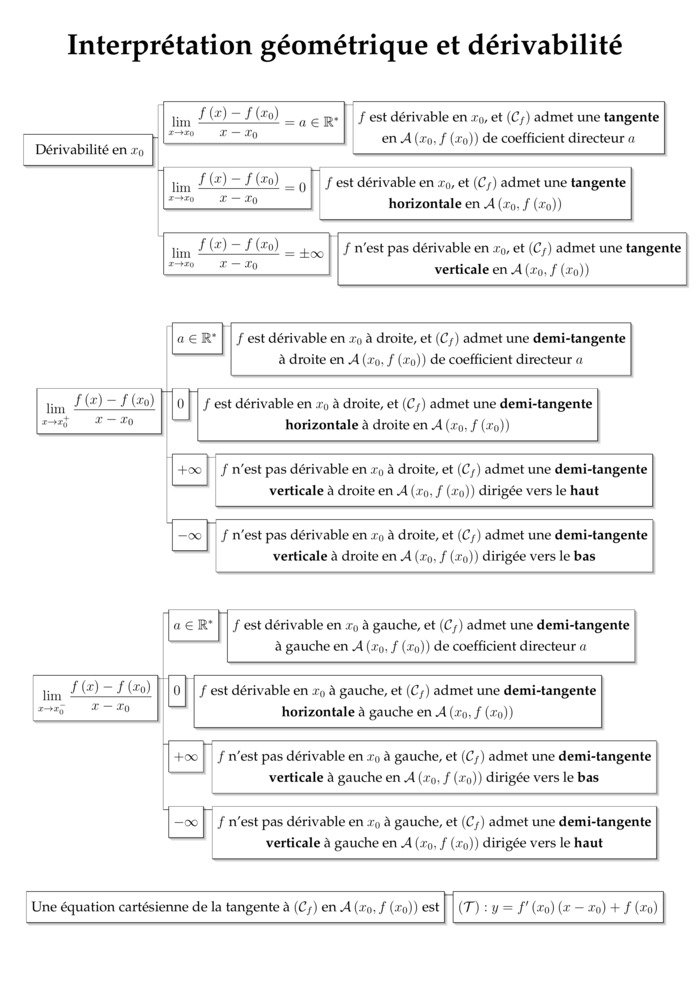
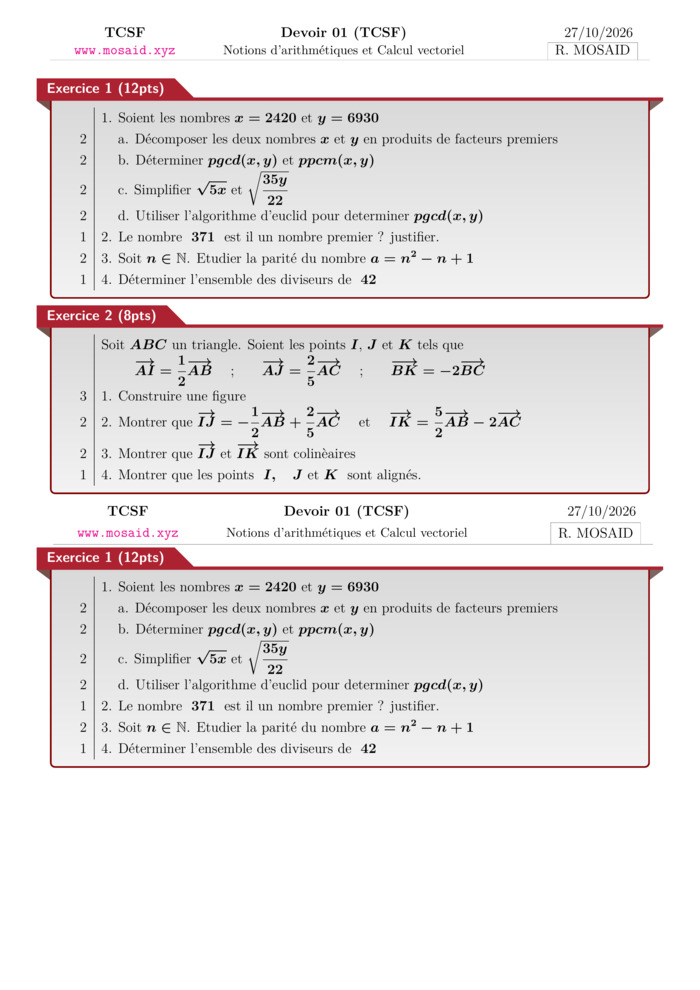
Solution — Devoir 01, S01, artihmétiques et calcul vectoriel , 2026 A
02 Nov 2026 • 1 views
حل • Maths • Tronc Commun Sciences
Devoir 01, S01, artihmétiques et calcul vectoriel , 2026 A
02 Nov 2026 • 19 views
امتحان • Maths • Tronc Commun Sciences
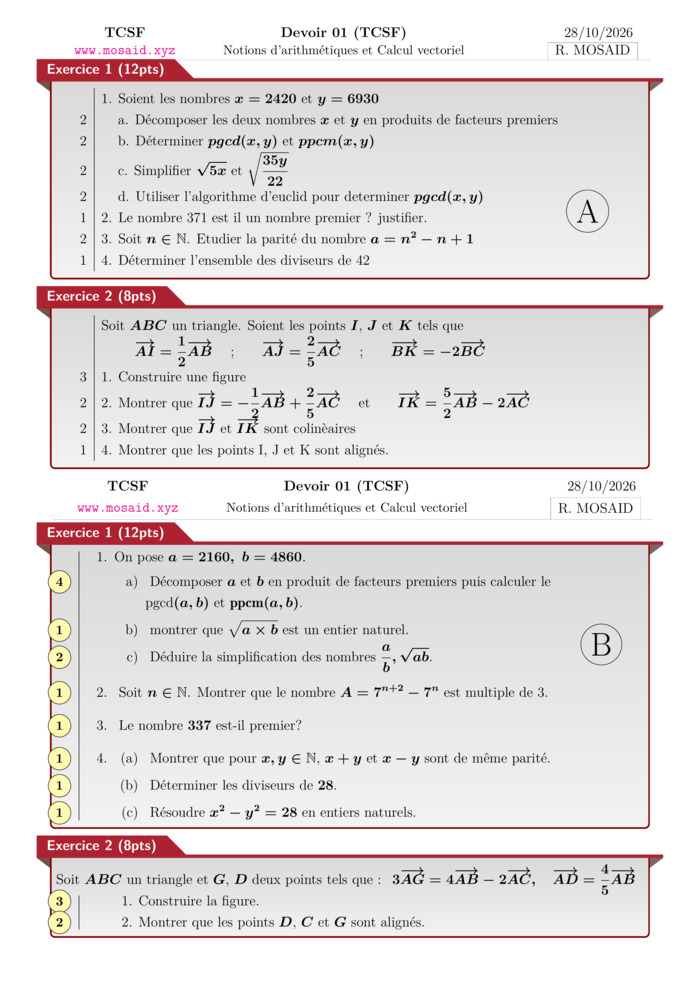
Solution — Devoir 01, S01 en arithmétiques et calcul vectoriel, 2026-2027 - ab
02 Nov 2026 • 1 views
حل • Maths • Tronc Commun Sciences
Devoir 01, S01 en arithmétiques et calcul vectoriel, 2026-2027 - ab
02 Nov 2026 • 1 views
امتحان • Maths • Tronc Commun Sciences
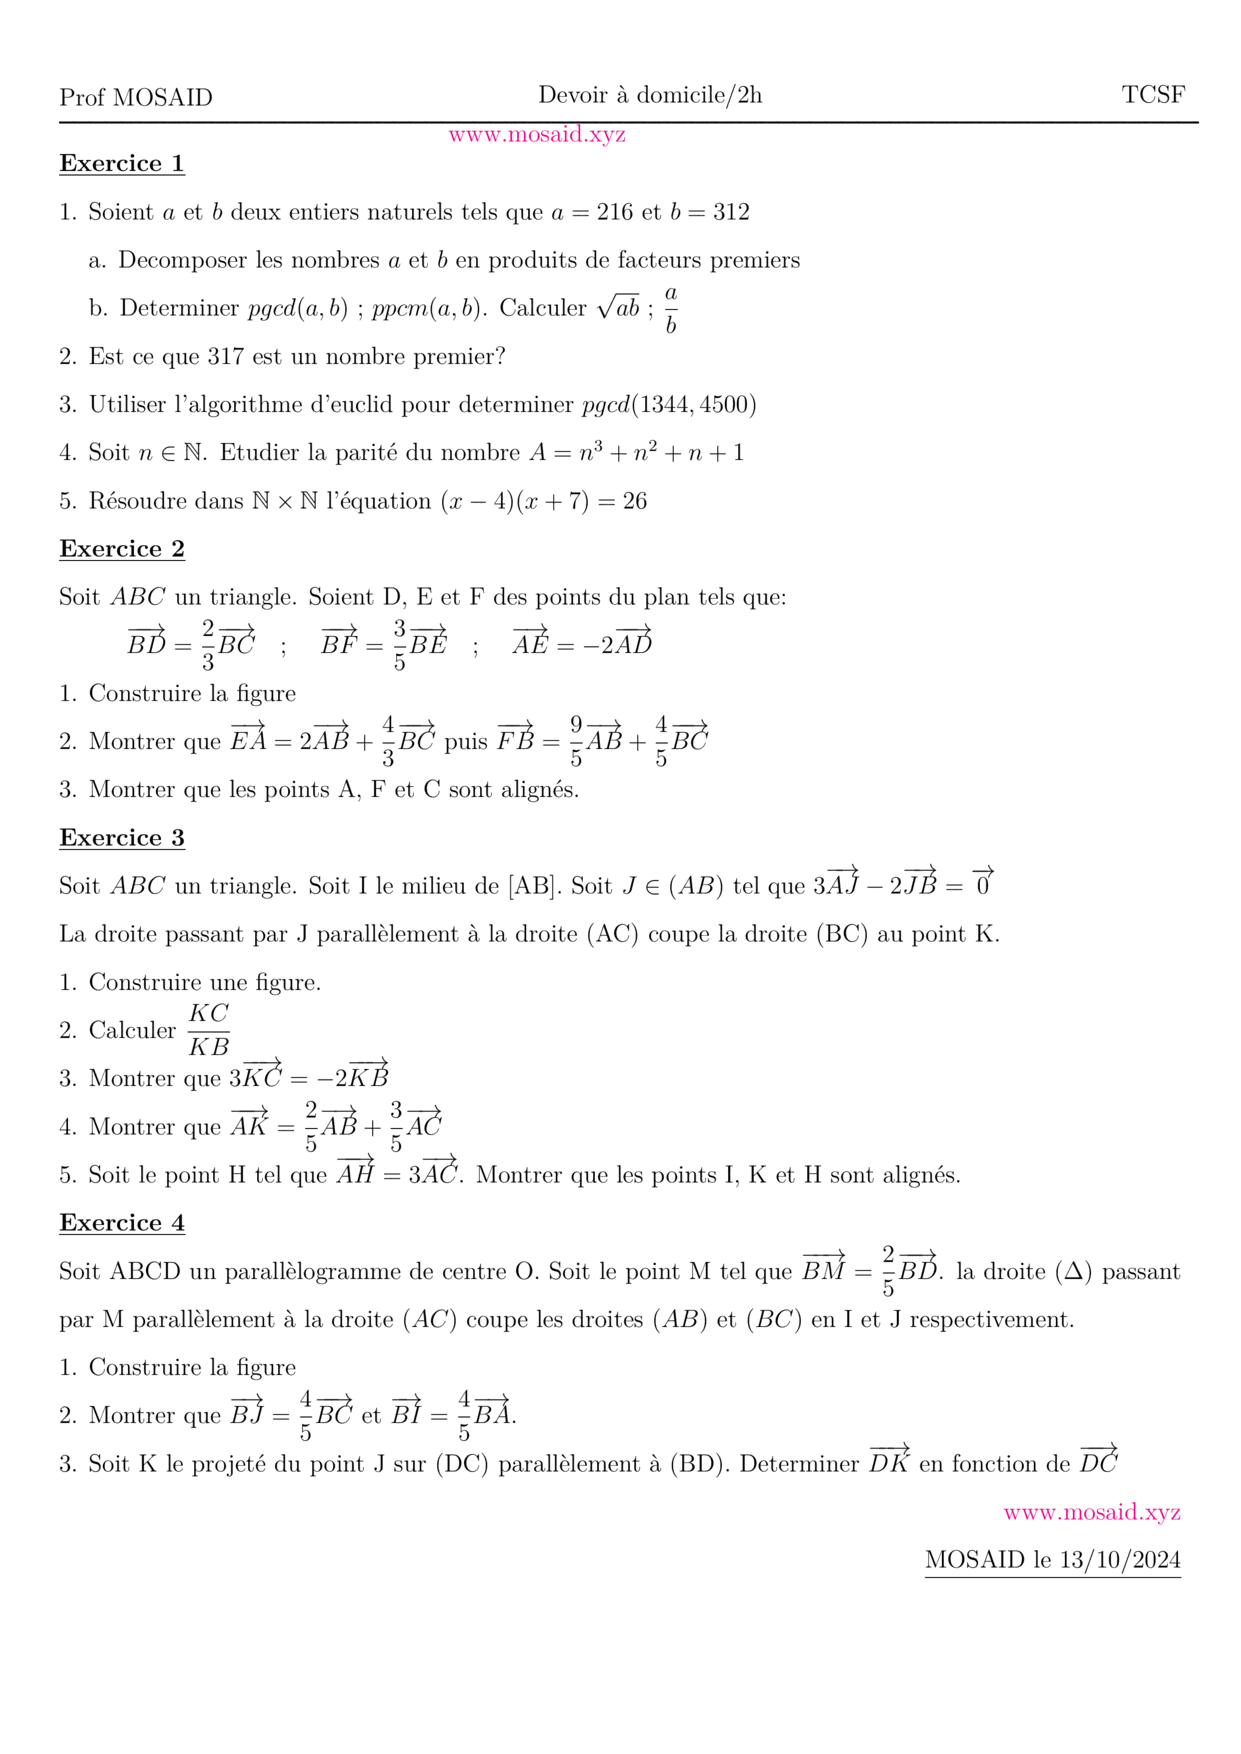
Solution — DM 1 - Arithmetiques, Calcul vectoriel et projection
27 Oct 2026 • 1 views
حل • Maths • Tronc Commun Sciences
الأكثر مشاهدة
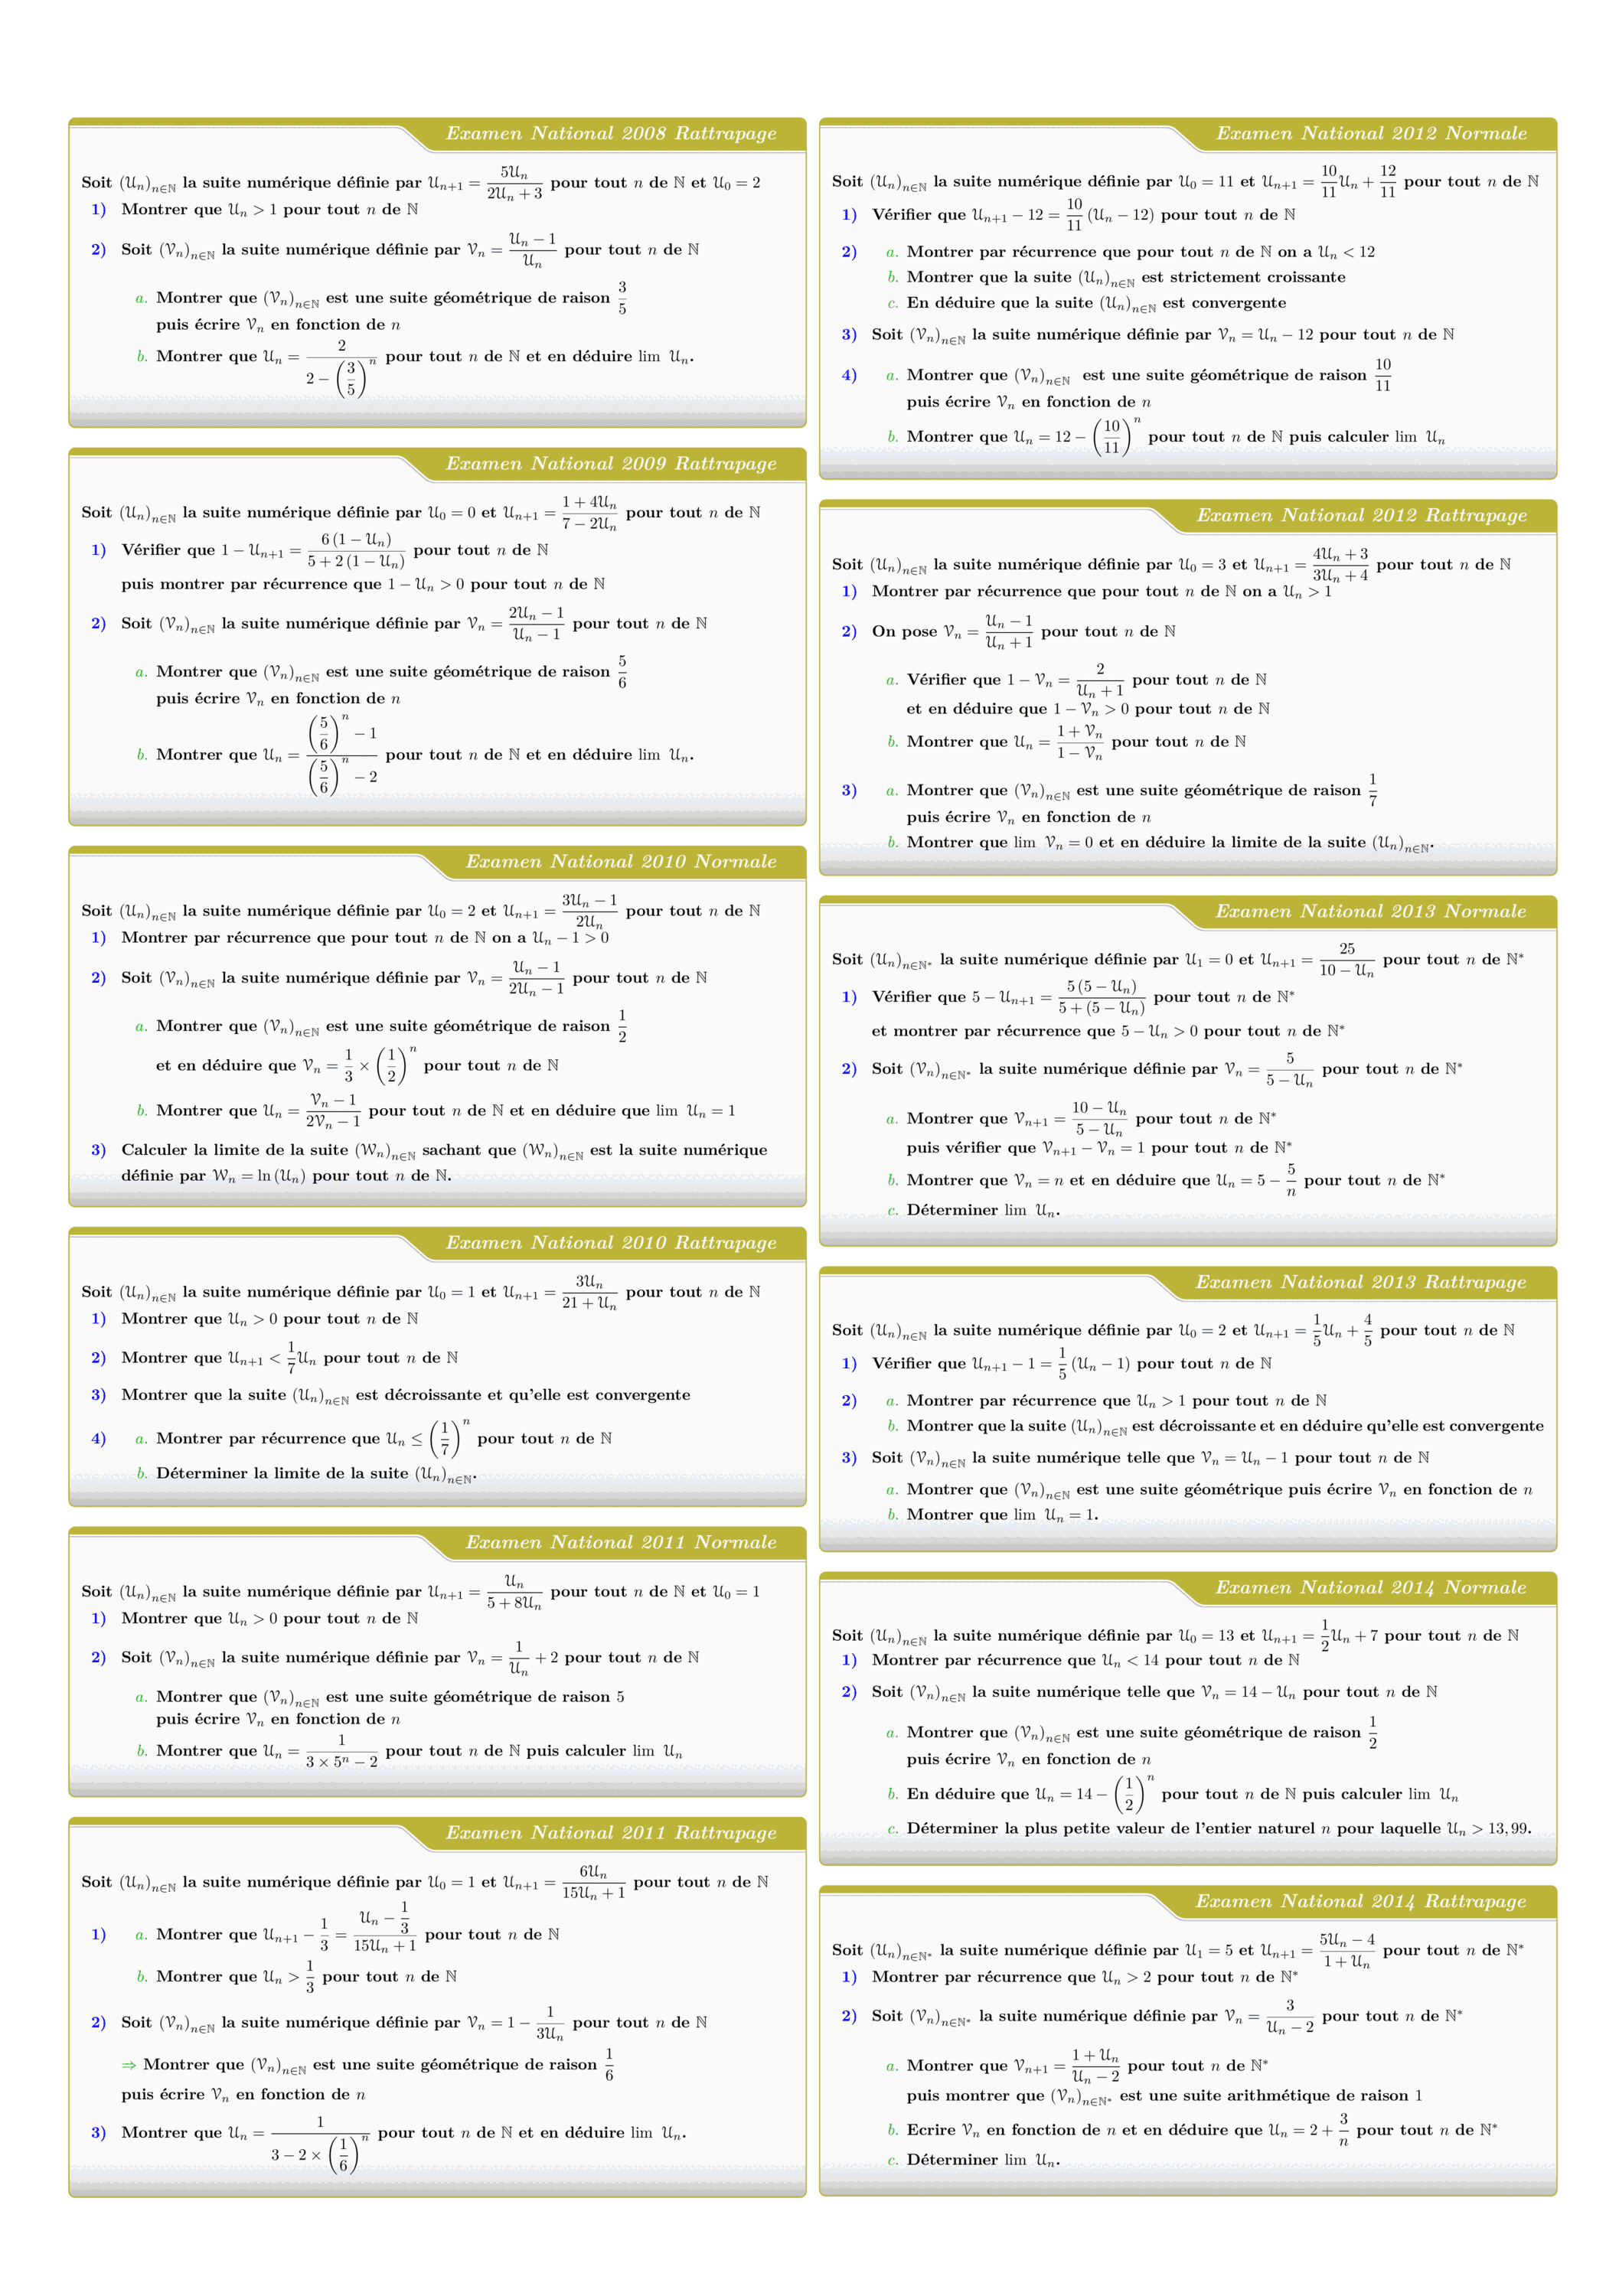
Tous les sujets des suites numériques des examens nationaux 2008 - 2022
views: 3.15K
امتحان • Maths • 2 Bac Science
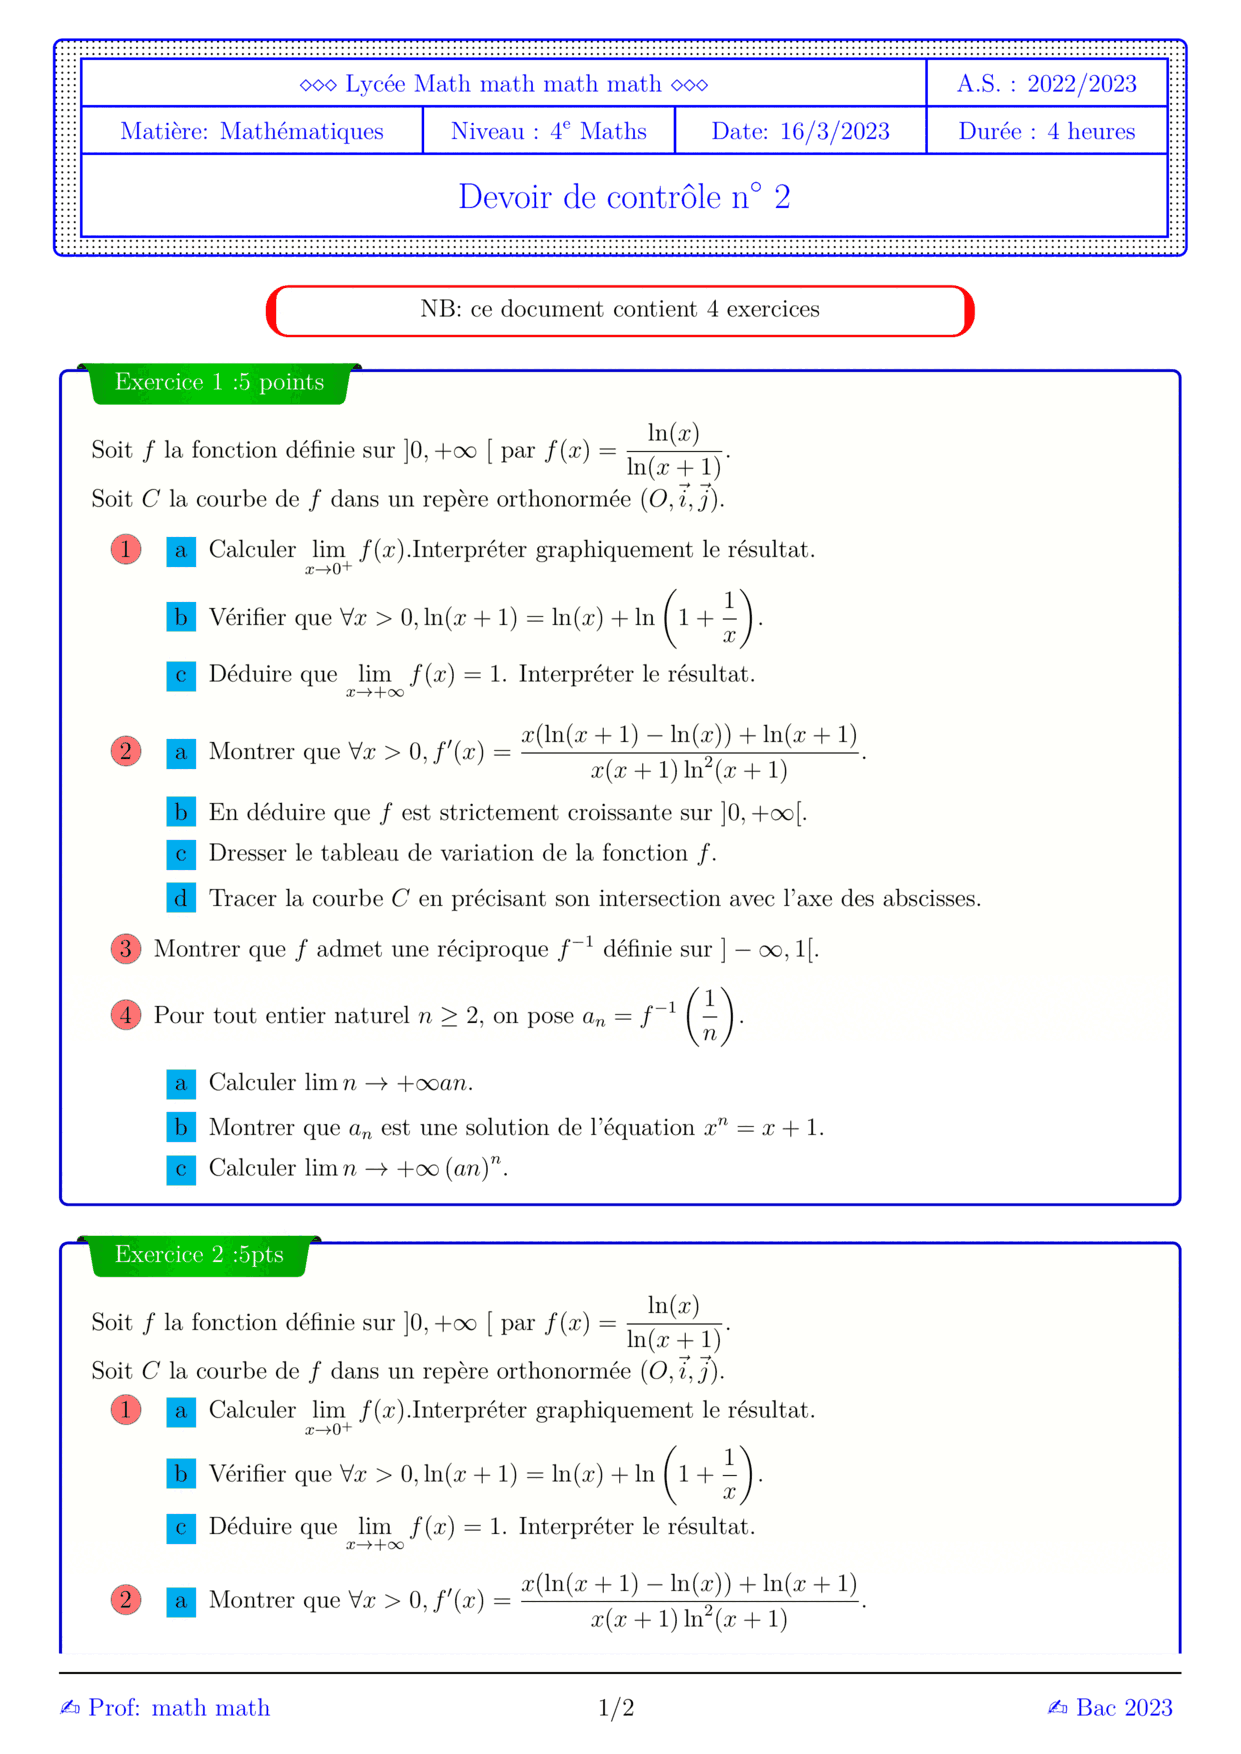

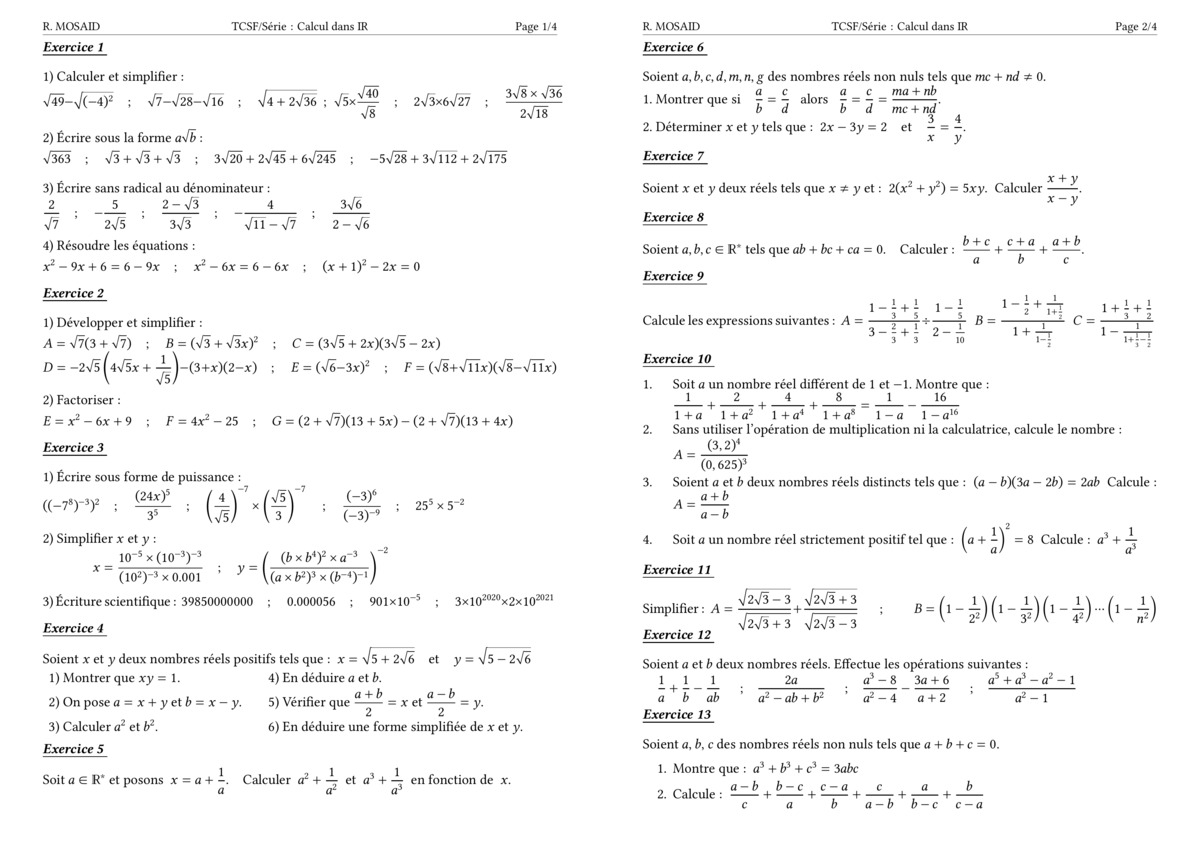
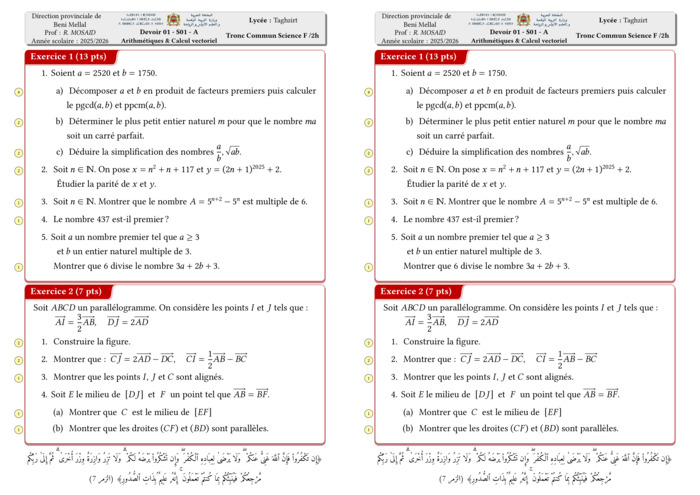
Control 01 S01 En arithmétiques et Calcul vectoriel - A 2025-2026
views: 2.15K
امتحان • Maths • Tronc Commun Sciences
DM 1 - Arithmetiques, Calcul vectoriel et projection
views: 1.99K
امتحان • Maths • Tronc Commun Sciences
MATHEMATIQUES Examens nationaux 2003-2021 2 Bac.Sciences expérimentales
views: 1.98K
امتحان • Maths • 2 Bac Science
Recent Articles





Most Viewed Articles



The Ultimate Vim Setup (My 2024 vimrc ) : Essential Commands, Configurations, and Plugin Tips
Views: 1.49K
12 Apr 2024
Complete Tutorial: Creating Categories and Subcategories Using Pages in Pelican
Views: 1.14K
24 Jun 2025
اترك تعليقًا