Courbe d'une fonction périodique paire
📅 April 17, 2024 | 👁️ Views: 84
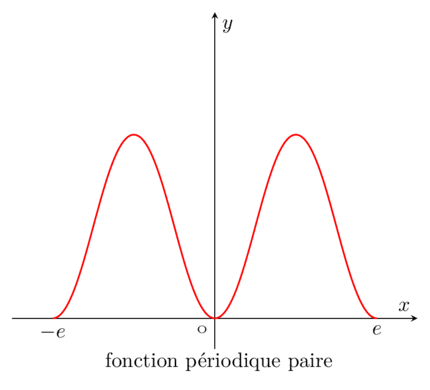
\documentclass{standalone}
\standaloneconfig{margin=2mm 2mm 2mm 2mm}
\usepackage{pgfplots}
\pgfplotsset{compat=newest}

\begin{document}

\begin{tikzpicture}[scale=1.00]
    \begin{axis}[axis lines=center,
        xlabel={$x$},
        ylabel={$y$},
        xtick=\empty,ytick=\empty,
    xmin=-2.5,xmax=2.5,
    ymin=-0.1,ymax=1,
        samples=200]
    \draw[red, thick,looseness=0.4]
      (-2,0)  to[out=0,in=180] (-1,0.60)
              to[out=0,in=180] (0,0)
              to[out=0,in=180] (1,0.60)
              to[out=0,in=180] (2,0);
      \node[below] at (2,0) {$e$};
      \node[below] at (-2,0) {$-e$};
      \node[below left] at (0,0) {\tiny O};
     \end{axis}
     \node[above] at (3.5,-0.5) {fonction périodique paire};
\end{tikzpicture}
\end{document}
Related Courses, Exams, and Exercises
- Courbe d'une fonction périodique paire - clip - axis line dashed Course
- Courbe d'une fonction périodique paire - clip Course
Course PDF:
📥 Download Courbe d'une fonction périodique paire (PDF)
if you find this content helpful, Please consider supporting me with a small donation
إن وجدت هذا المحتوى مفيدا، من فضلك إدعمني بمبلغ بسيط كتبرع
Buy me a coffee — إشتر لي قهوة
PayPal.me • عبر بايبالOr bank transfer • أو حوالة بنكية
Titulaire : RADOUAN MOSAID
RIB : 230 090 6501953211022000 65
IBAN : MA64 2300 9065 0195 3211 0220 0065
BIC / SWIFT : CIHMMAMC
Most Viewed Courses
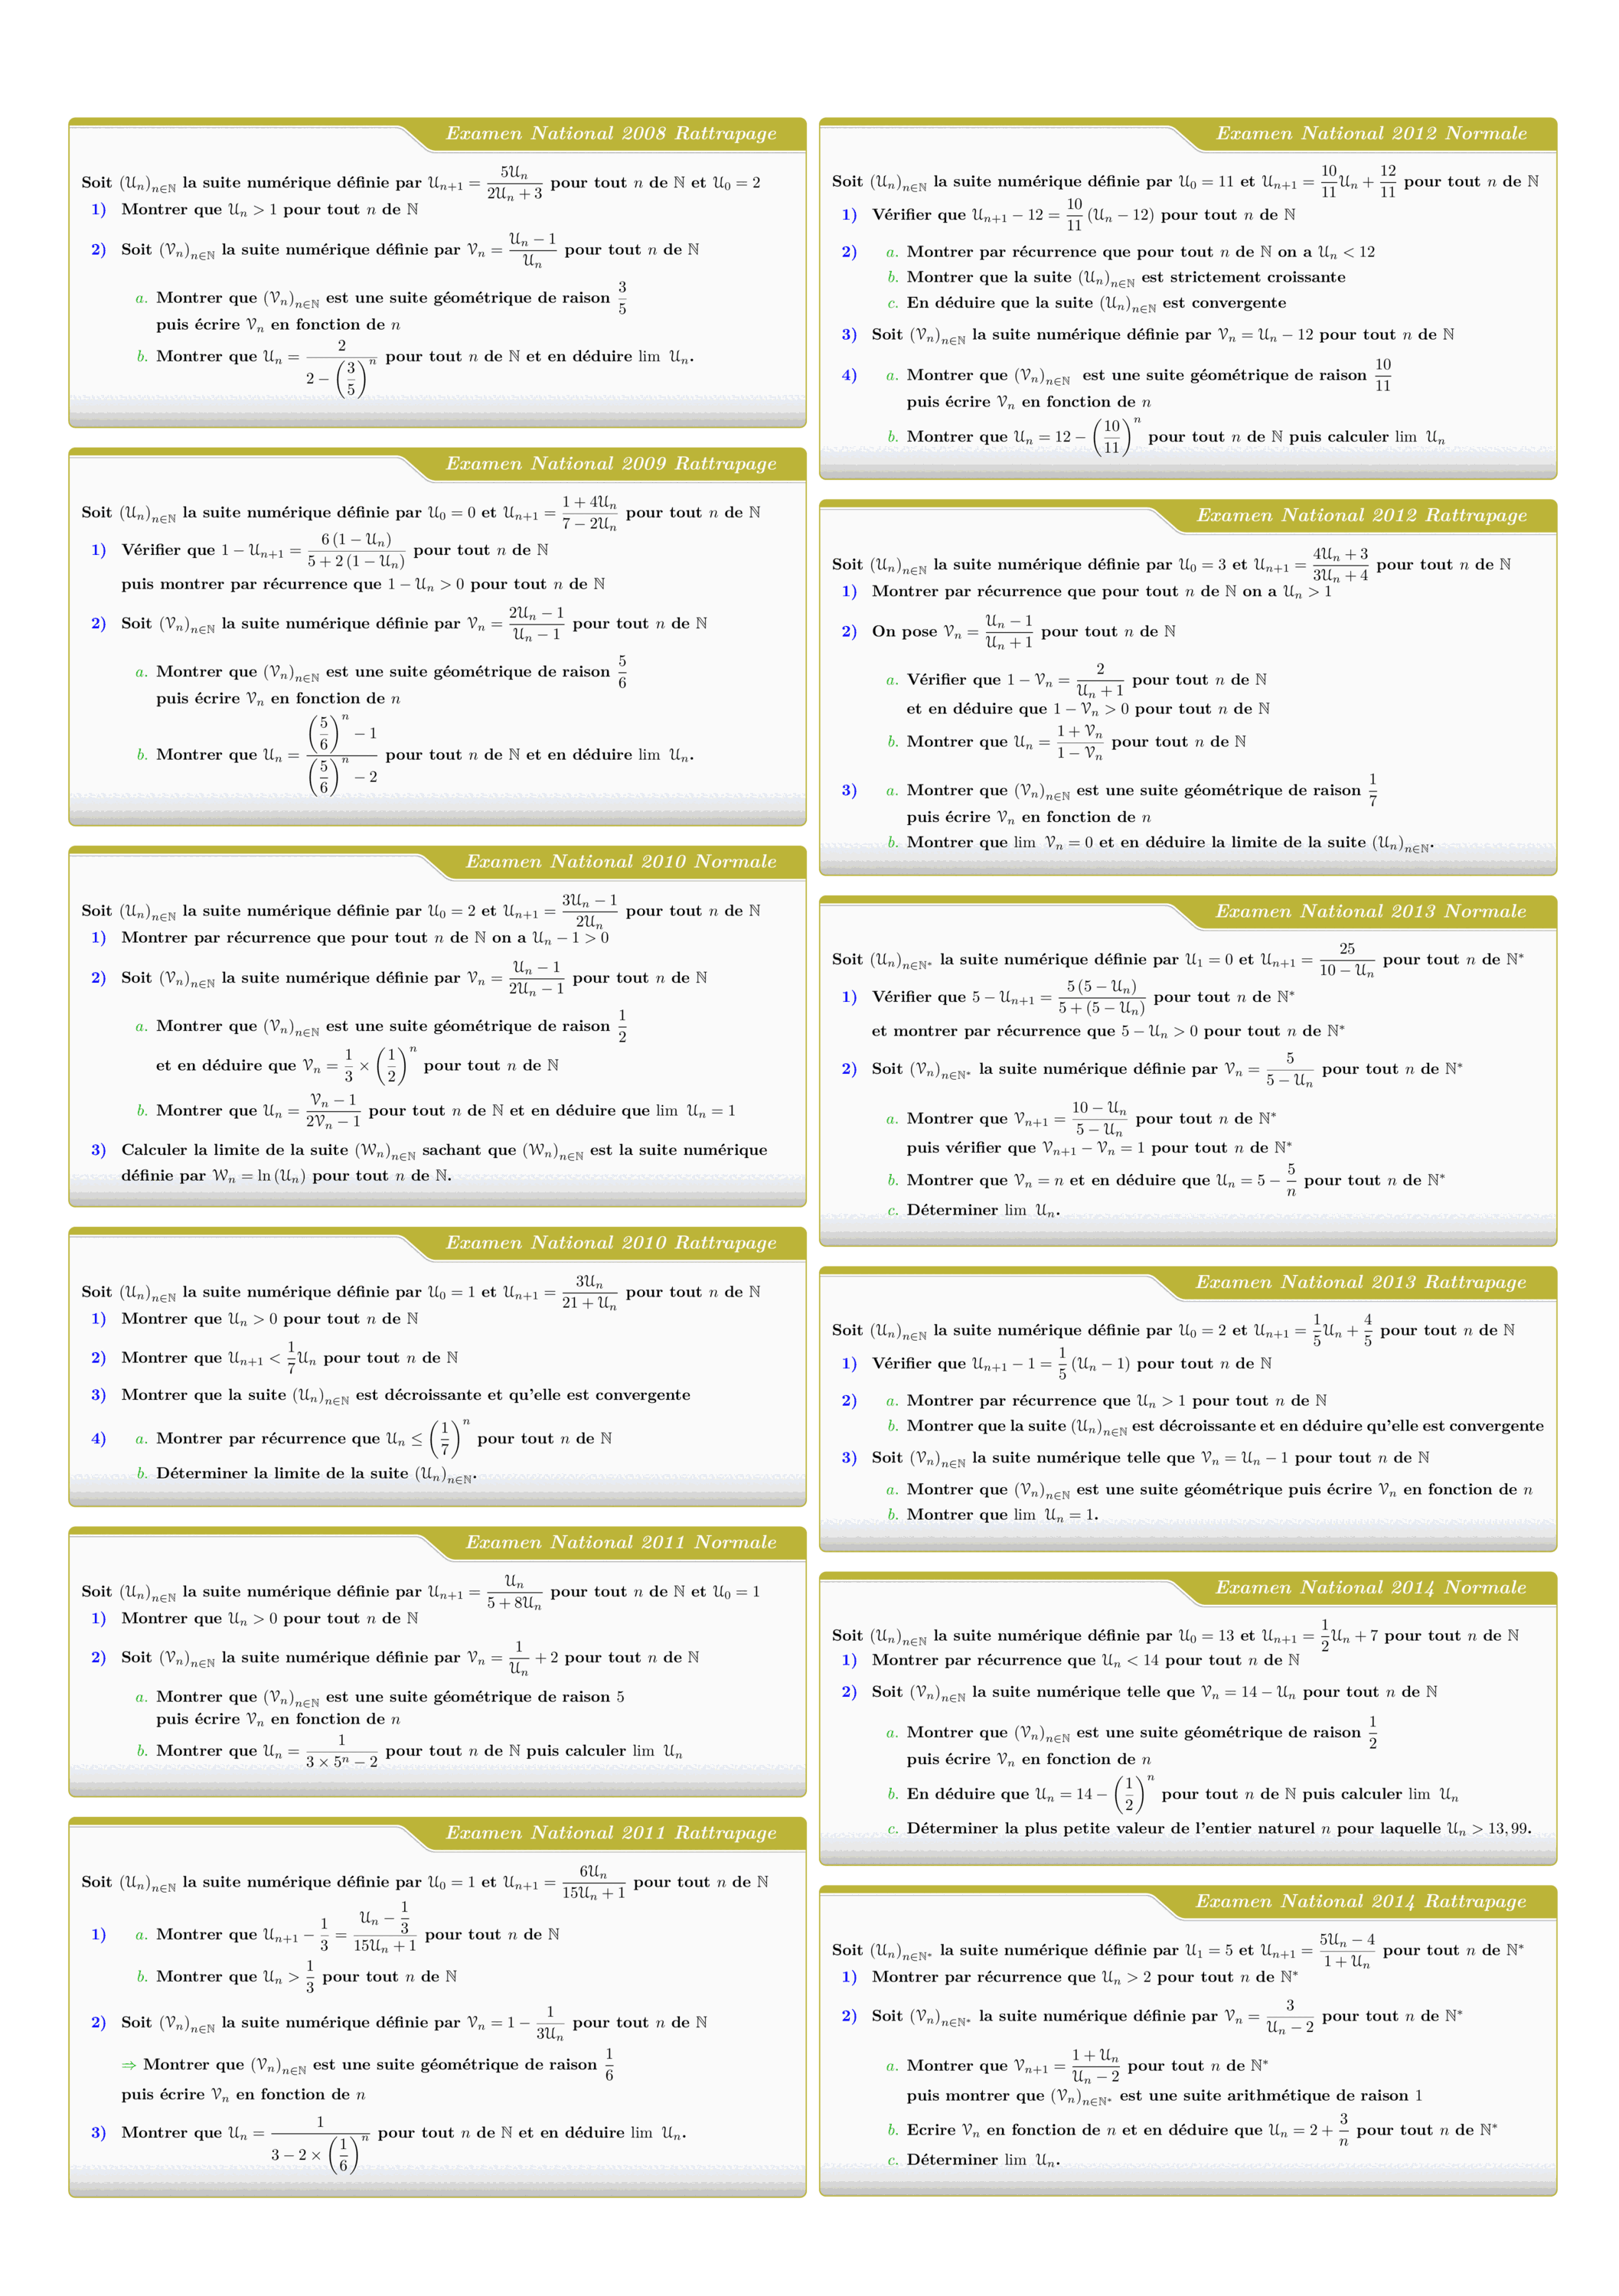
Tous les sujets des suites numériques des examens nationaux 2008 - 2022
Views: 1.91K
Exam • Maths • 2 Bac Science
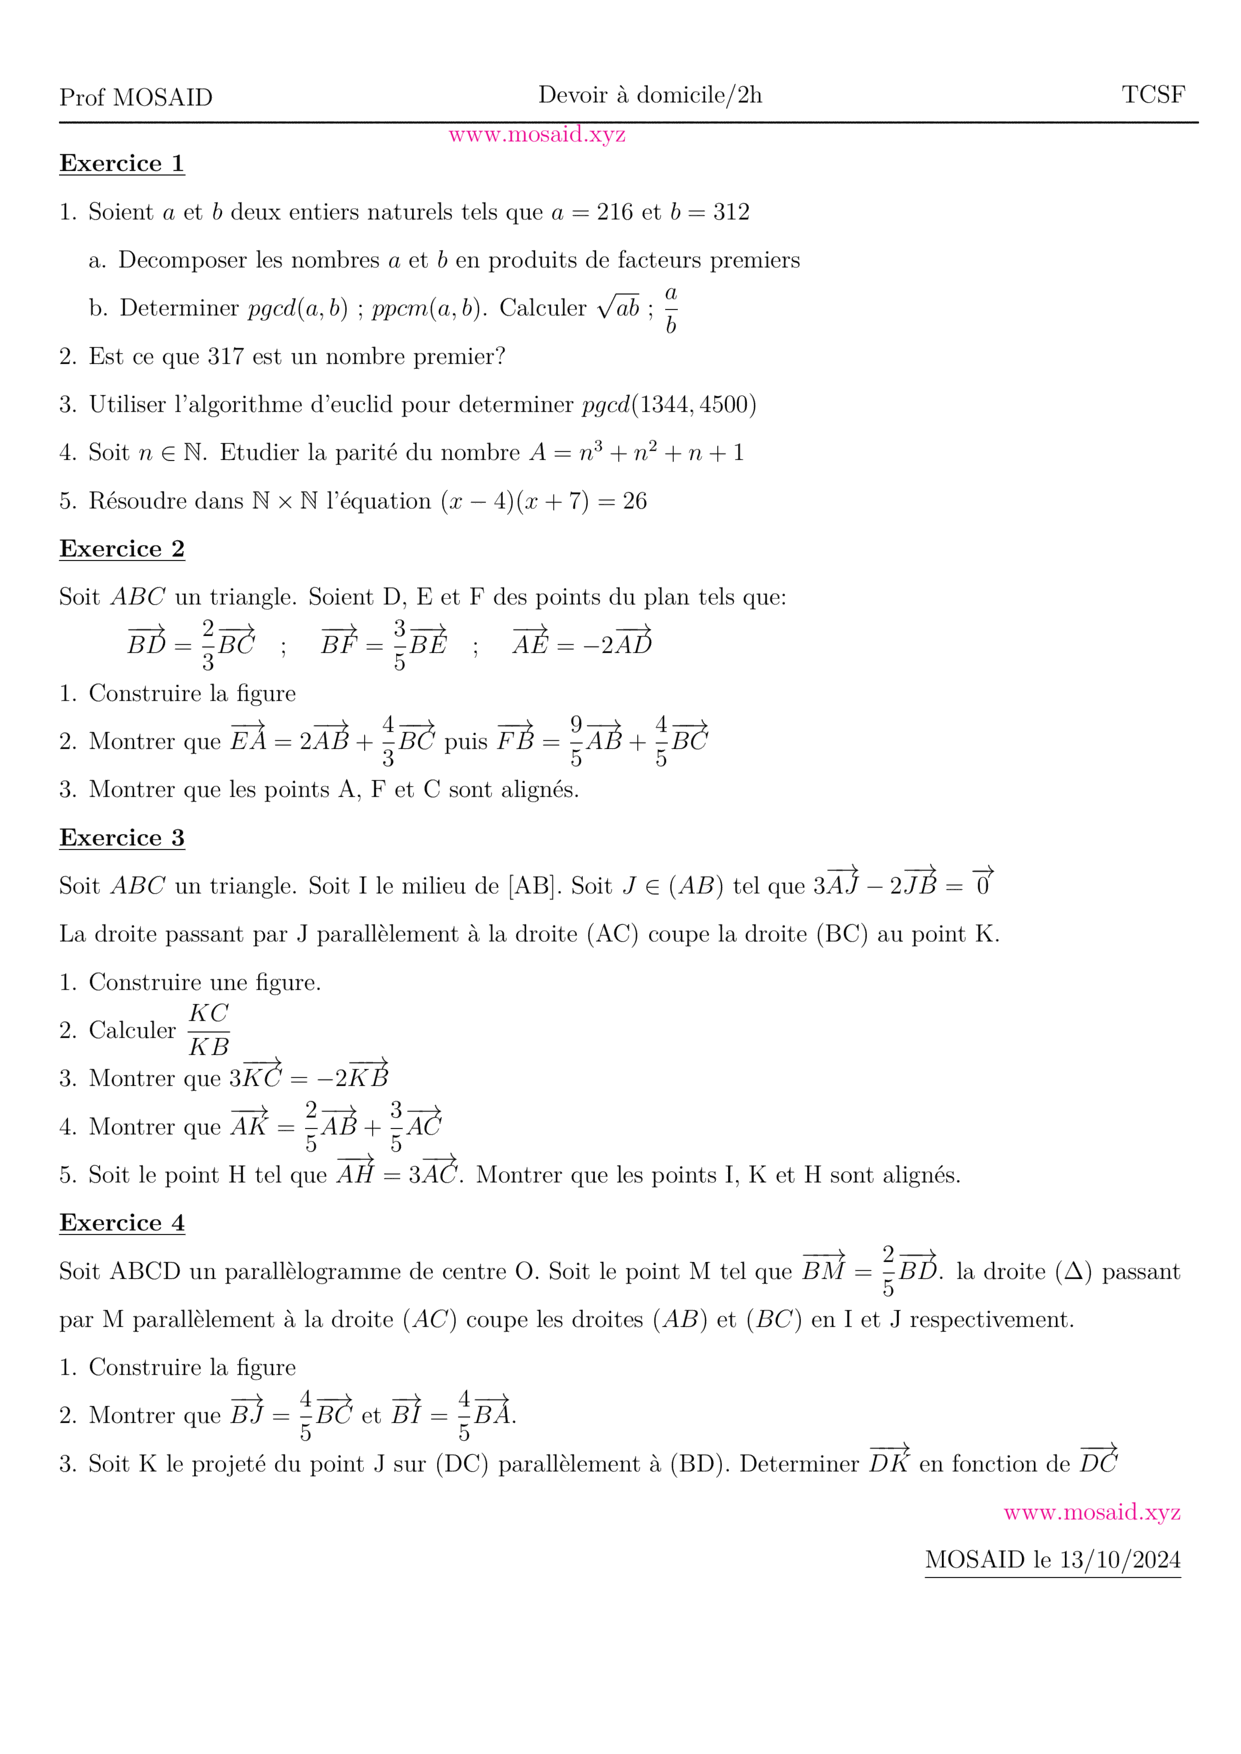
DM 1 - Arithmetiques, Calcul vectoriel et projection
Views: 1.68K
Exam • Maths • Tronc Commun Sciences
MATHEMATIQUES Examens nationaux 2003-2021 2 Bac.Sciences expérimentales
Views: 1.67K
Exam • Maths • 2 Bac Science
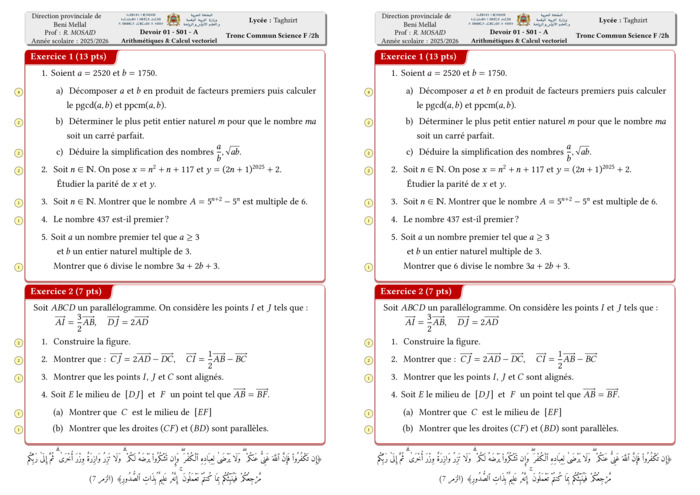
Control 01 S01 En arithmétiques et Calcul vectoriel - A 2025-2026
Views: 1.66K
Exam • Maths • Tronc Commun Sciences
Recent Articles

Boosting LaTeX Editing with Custom Vim Mappings
23 Nov 2025
Most Viewed Articles

The Ultimate Vim Setup (My 2024 vimrc ) : Essential Commands, Configurations, and Plugin Tips
Views: 1.01K
12 Apr 2024
