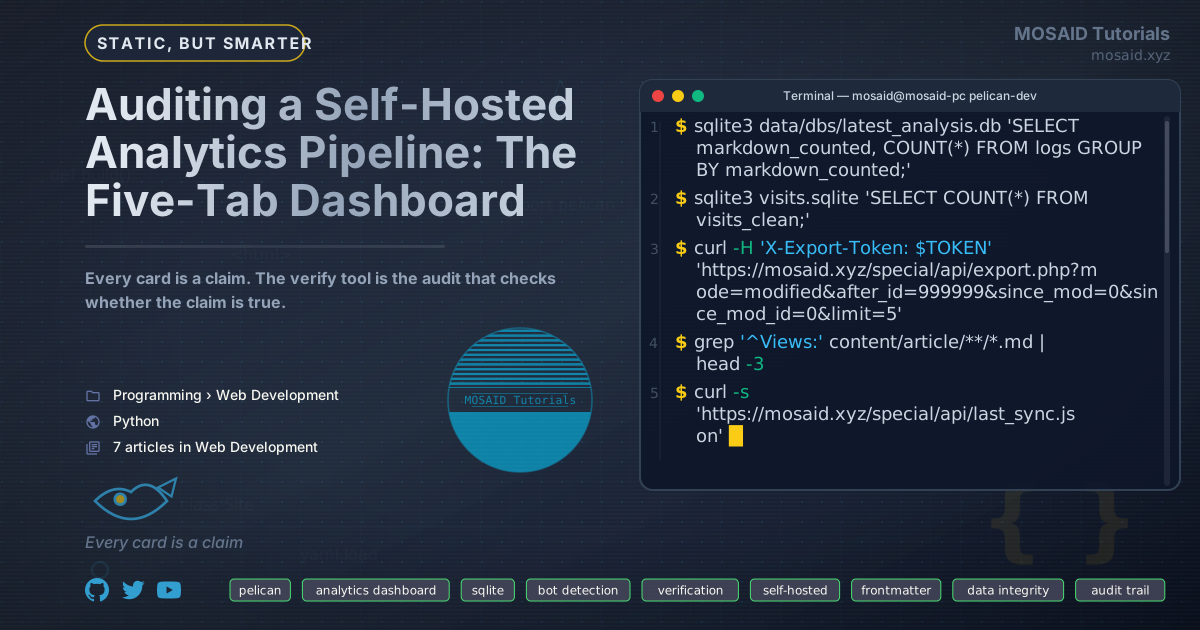
Auditing a Self-Hosted Analytics Pipeline: The Five-Tab Dashboard
The previous article in this series described the tracking and synchronization pipeline that records visits, filters bots, and writes visit counts into Pelican's markdown frontmatter. That article ended at the database. This one starts there.
The dashboard is the layer that turns the database into questions you can answer. It is not a reporting product bolted onto the side of the system. It is the audit surface: the place where you find out whether the pipeline is doing what you told it to do, whether the bot filter is over- or under-matching, and whether the count in your frontmatter matches the count in your database.
Every card in the dashboard is a claim about your data. The verify tool is the audit that checks whether the claim is correct. That is the organizing principle of the whole dashboard, and every design decision below follows from it.
The illustrations in this article are SVGs, not screenshots. They render the same layouts as the actual dashboard with representative data. The numbers are fabricated for legibility — the shapes and card structures are the real thing.
Why the dashboard is an audit tool, not a product
Most analytics dashboards are oriented toward a single question: how are we doing? They optimize for glanceability. The number goes up, the number goes down, someone looks at it and feels a certain way.
This dashboard is oriented toward a different question: is this number correct? It has to be, because the number is going to end up in the markdown frontmatter of every published page. A wrong number in the database becomes a wrong number in the built site. The dashboard is the last place you can catch it before it ships.
Three design decisions follow from that orientation.
•The dashboard reads from visits_clean. Every card filters bots by default. There is no "including bots" toggle, because "including bots" is what the anomaly panel is for. The dashboard shows you the number that is going to be published, not the raw event count.
•The Health tab shows what got filtered. The other four tabs hide the bot filter from you. The Health tab is where you see it. The anomaly panel, the backfill tool, the verify tool — these are the surfaces where the filter's decisions become visible and correctable.
•Every card is scoped by a time window that it declares. "Last 24 hours", "last 7 days", "all-time" — every card title says which window it is showing. A card that says "47 visits" without a window is not a claim you can audit. A card that says "47 visits in the last 24 hours" is.
The first bullet compresses into a view. The clean view is the whole bot filter, and the whole bot filter is one predicate.
CREATE VIEW visits_clean AS
SELECT * FROM visits
WHERE COALESCE(is_bot, 0) = 0;
Every card except the anomaly panel reads from this view. The view is where "include bots" would live if the dashboard offered it — it is deliberately absent. The anomaly panel reads from visits directly because the only honest way to audit what was excluded is to look at what was excluded, and that means reading the table the view is built from.
The five tabs at a glance
The tabs are a staged zoom-out. Overview tells you whether anything is happening. Audience tells you who is making it happen. Content tells you which pages they are reading. Engagement tells you how they get there and where they leave. Health tells you whether any of the numbers above can be trusted.
The first four tabs answer questions about visitors. The fifth tab answers questions about the dashboard itself. That asymmetry is deliberate. Every analytics product shows you the first four. The fifth is what makes the numbers on the first four defensible.
The Overview tab: is anything happening
Overview is where you land when you open the dashboard. It answers one question: is the site's traffic within its normal range? Every card in this tab is a different way of answering that.
Activity by time window
Eight cards, eight windows. The traffic at any scale from "five minutes ago" to "the last month." The color coding is the useful part:
•Red means the count is unusually high for that window — a burst is in progress.
•Amber means elevated but not alarming.
•Default is everything else.
The windows are not independent. A burst that shows up in the 5-minute card will show up in the 30-minute card five minutes later, and in the 1-hour card an hour later. That lag is the useful signal: a spike that only appears in the 5-minute card is a spike. A spike that persists across all four short windows is a trend.
Hourly activity and growth
The sparkline is the single most informative card in the dashboard. It shows 168 hours of activity compressed into a single strip. The dashed average line tells you what "normal" looks like. The red bar tells you where the peak is.
Three things to read on the sparkline:
•The peak. If the red bar is an isolated spike in an otherwise quiet chart, that is a burst. If it is one of a handful of tall bars, that is real traffic. The anomaly panel in the Health tab gives the classifier's verdict, but the shape alone is often enough to know which.
•The average line. If it is rising left-to-right across the seven days, the site is growing. If it is flat, the site is steady. If it is falling, the site is declining. This is the most useful single-glance indicator in the whole dashboard.
•The gaps. Hours with no bar at all are hours with no visits. A gap at 03:00 every night is normal. A gap at 14:00 on a Tuesday is not, and it might mean the tracker is broken rather than the site being quiet.
The growth pills below the sparkline give the same signal in a different format. Positive growth is green, negative is red, and each pill names its comparison window and its numbers. The pill is the glanceable version; the sparkline is the auditable one.
The Content tab: what visitors are reading
The Content tab exists because the Overview tab answers "how much" and the Content tab answers "what." The card above is the all-time ranking; the tab also has 24-hour, 7-day, and 30-day versions of the same table, plus a "Top Pages by Unique Visitors" variant for the pages that have fewer repeat readers, and a "New Pages" card for URLs first seen in the last thirty days.
The rank badges (gold, silver, bronze) are the one piece of pure decoration in the dashboard. They exist because they make the top of the list scannable at a glance. The progress bars beneath each URL are functional: they show what fraction of the top page's traffic each row is receiving. A flat bar at the bottom means the long tail — those pages get a tiny fraction of the traffic of the top.
Every card in the Content tab is sorted by visit count, not by URL. That is deliberate. The question this tab answers is "where is the traffic going," and alphabetical order does not answer that question.
The "Trending Now" card at the bottom of the tab is the exception: it is sorted by growth ratio (last 24 hours vs. the prior 24 hours), and it only shows pages with at least three recent views. That filter matters — a page that got one visit today and zero yesterday has an undefined ratio. The three-view minimum is the threshold below which the ratio is more noise than signal.
The Engagement tab: how visitors behave
The heatmap is a 7×24 grid. Each cell is one hour of one weekday, averaged across the last ninety days. The color is the count.
This card is the answer to "when is the site's traffic concentrated." A dark cell at Tue 08:00 means that hour is consistently busy. A dark band across Monday through Friday, 09:00 to 17:00, means the site's audience has a normal workweek. A dark weekend means the site's audience is browsing on personal time.
The one cell that stands out in the illustration — Tue 08:00, unusually dark compared to its neighbors — is not real visitor traffic. That is the 02:00 UTC burst from the previous article, shifted six hours for the reader's local timezone. It shows up here, in the engagement tab, because the heatmap reads from the same database as everything else, and the burst was recorded before it was marked as bot.
The heatmap is the card that catches what the anomaly panel already flagged but that the backfill has not yet corrected. It is a reminder that "clean" is a state, not a property of the raw table.
The Engagement tab also has entry pages, exit pages, bounce rate, and average session duration. Those cards answer a different question — where do sessions start and where do they end — but they share the same design philosophy: read from visits_clean, declare the time window, and sort by the quantity the card is about.
The Health tab: can you trust the numbers
The first four tabs answer questions about visitors. The Health tab answers questions about the dashboard. It is the tab you open when you suspect a number, when you have just marked a bot retroactively, or when the site's frontmatter counts and the dashboard's clean totals disagree.
Three cards in this tab matter more than the rest.
The anomaly panel
The anomaly panel is the only card in the dashboard that reads from the raw visits table instead of visits_clean. That is the entire point. It shows you the hours where the site received more events than its baseline — 12.4× in this example — along with six classification signals per hour: URL diversity, device diversity, language diversity, user-agent diversity, IP diversity, and peak requests per second.
The classifier's verdict is a badge in the top right. Six classifications exist:
| Classification | Signal | Verdict |
|---|---|---|
| Scripted / bot-like | ≥60% of inter-request intervals are identical | Almost certainly a bot |
| Parallel requests | ≥10 events in the same second | Almost certainly a bot |
| Crawl pattern | ≥80% unique URLs, all direct (no referrer) | Almost certainly a bot |
| Refresh loop | ≤2 distinct URLs, ≥30 events | Probably a bot |
| Single-page spike | One URL gets ≥70% of traffic, ≥50 events | Ambiguous |
| Diverse real activity | Many URLs, devices, languages, IPs | Probably real users |
The panel does not take any action. It only reports. That separation is deliberate: the classification is a claim, and the classification is auditable. If the panel says "parallel requests" but the top-URLs table shows a single page getting the majority of traffic, the classification is wrong. The panel gives you the raw evidence to make that call yourself.
The verify tool
This is the card that makes the dashboard defensible. It is a five-check contract against the current set of bot-marked rows. If all five pass, the bot filter is correct. If any fail, the failing check exposes a revert button scoped to exactly the rows that failed.
The five checks are:
•1. Click-through visitors marked as bot. Every marked row with a referrer is suspect. A real visitor clicked something to reach your site; a bot does not. This is the highest-signal check. If it fails, do not publish the article; fix the bot filter first.
•2. Content pages marked as bot. Every marked row whose URL is a content page (/article/*, /courses/*, /blogs/*, etc.) is suspect. A student landing on a course page is not a bot. This check can tolerate a small number of hits — the backfill tool allows up to 20 false positives before flagging — but a large number means the classification is over-matching.
•3. Repeated IPs among bot marks. If a single IP hash appears in more than three marked rows, that is a signal. A bot proxy makes one request and disappears. A real user browses multiple pages. The card shows sample URLs for each repeated IP, so you can see whether the IP was hitting tag pages (benign) or content pages (over-match).
•4. Hourly distribution of bot marks. A correctly-marked burst appears in one to four consecutive hour buckets. Marks scattered across the day mean the backfill over-matched, or that a slow crawler has been marked across its full window.
•5. bot_reason breakdown. Every marked row carries a reason string. The sum of all reasons should equal the banner total. A mismatch means rows were marked through a path you forgot, or that a code change renamed a reason.
The database health card
Four KPIs, each answering a question you should be able to answer before you trust the dashboard.
•DB size. A SQLite file that is growing faster than your traffic is a sign that some query is not being indexed. A file that is not growing at all is a sign that the tracker is not running.
•Rows (clean / total). The "of 4,316 total" line is the bot count. If the bot count is far larger than the clean count, the site is being crawled heavily and the bot filter is doing real work. If it is far smaller, the site is either quiet or the filter is under-matching — check the anomaly panel to distinguish.
•Oldest event. The earliest recorded visit. If this date moves forward unexpectedly, your oldest data has been deleted or archived. If it is stuck at the same date for weeks, the database is not growing at the head either.
•Newest event. The most recent recorded visit. This is the freshness check. If it says "3 days ago" but your site is receiving traffic, the tracker is broken.
The verify tool's five checks in detail
The verify tool is the highest-value card in the entire dashboard, and the one most people will skip because it does not show growth. That is the wrong instinct. The card that catches a real-visitor mark as bot is worth ten growth charts.
Each check tests a distinct class of false positive. If check 1 fails, every marked row with a referrer is probably real. If check 2 fails, every marked content page is probably real. If check 3 fails, the repeated IPs are probably real users. If check 4 fails, the marks are scattered across time, which means they were not a burst. If check 5 fails, the bot_reason values do not add up, which means rows were marked through a code path that was forgotten.
The check that matters most is check 1. A bot has no referrer because it does not click. If a marked row has a referrer, the most likely explanation is not "the bot spoofed a referrer" — it is "this was a real visitor."
When a check fails, the card exposes a scoped revert button. The scopes are:
| Scope | Reverts |
|---|---|
click_through | Only the marked rows with a non-empty referrer |
content_pages | Only the marked rows whose URL is a content page |
content_from_suspicious_ips | Only the marked content pages whose IP is one of the repeated ones |
ua_sweep | Only the rows marked by the UA-token list |
burst | Only the rows marked by the burst classifier |
all | Every marked row |
The scoped reverts matter because they are the tool you reach for when a check fails. If check 1 fails with three rows, you revert the click_through scope and move on. You do not revert every bot mark, because that would also undo the correct marks. The ability to fix one failure without unwinding the whole filter is what makes the verify tool usable in practice.
The queries behind the audit
The five checks are not descriptions; they are queries. Each one returns rows that should not exist. Each failure has a scoped revert. This section shows the SQL the verify tool runs, along with the two supporting queries — the burst-detection threshold and the heatmap aggregation — that the rest of the dashboard depends on.
The schema in these queries is specific to this pipeline: visits holds the raw events, visits_clean is the filtered view, and is_bot and bot_reason are the columns the backfill writes. The queries are meant to be read as evidence, not copy-pasted into a different schema.
The burst-detection threshold
The anomaly panel and the verify tool both need a definition of "unusual." The dashboard computes it from the median of non-zero hourly counts, not from the mean — a single burst hour would skew the mean upward and hide subsequent bursts.
WITH hourly AS (
    SELECT visited_at - (visited_at % 3600) AS h,
           COUNT(*) AS c
    FROM visits
    WHERE visited_at >= strftime('%s', 'now', '-7 days')
    GROUP BY h
),
nonzero AS (
    SELECT c FROM hourly WHERE c > 0
),
ranked AS (
    SELECT c,
           ROW_NUMBER() OVER (ORDER BY c) AS rn,
           COUNT(*) OVER () AS total
    FROM nonzero
)
SELECT AVG(c) AS baseline
FROM ranked
WHERE rn IN ((total + 1) / 2, (total + 2) / 2);
The windowed median works for both odd and even counts: for odd counts the two middle indices coincide, for even counts they are the two central values. The actual PHP implementation is a single pass over the sorted hourly array, but the shape is the same — one pass to bucket, one pass to find the median. The threshold is then max(100, 5 * baseline).
The floor of 100 events per hour is what keeps the anomaly panel honest on a low-traffic site. Without it, a site whose median hour is 3 events would flag every hour with 16 as an anomaly, and the panel would be noise.
The heatmap aggregation
The heatmap is the one card whose query is not obvious from looking at the card. A 7×24 grid is one GROUP BY, but the weekday extraction has to be aware of how the data is stored — visited_at is a Unix timestamp, so every extraction has to convert it first.
SELECT CAST(strftime('%w', datetime(visited_at, 'unixepoch')) AS INTEGER) AS dow,
       CAST(strftime('%H', datetime(visited_at, 'unixepoch')) AS INTEGER) AS h,
       COUNT(*) AS c
FROM visits_clean
WHERE visited_at >= strftime('%s', 'now', '-90 days')
GROUP BY dow, h;
Ninety days is the window. A longer window would average across seasonal changes; a shorter one would have too few samples for the late-night hours. The 90-day window is the same one the dashboard uses for the busiest-day and quietest-day cards, so the heatmap and the daily chart tell a consistent story.
The timezone shift happens at render time, not in SQL. The heatmap is computed in UTC and shifted by the reader's offset in the client, which is why the burst from the previous article appears at Tue 08:00 in the illustration instead of the 02:00 UTC it was recorded at.
The five verify checks
Each verify check is a SQL query that should return an empty set. If it returns rows, the bot filter over-matched, and the revert scoped to that check is what fixes it. The query is the specification, and the revert button is the remediation.
Check 1 — click-throughs marked as bot. This is the highest-signal check. A real visitor clicks something; a bot does not. Every marked row with a non-empty, non-direct referrer is suspect.
SELECT id, url, referrer, user_agent,
       datetime(visited_at, 'unixepoch') AS when_utc
FROM visits
WHERE is_bot = 1
  AND referrer IS NOT NULL
  AND referrer != ''
  AND referrer != '(direct)'
ORDER BY visited_at DESC;
Check 2 — content pages marked as bot. A student landing on a course page is not a bot. Every marked row whose URL is a content page is suspect, and a large result set means the classifier over-matched the entire session.
SELECT id, url, referrer, datetime(visited_at, 'unixepoch') AS when_utc
FROM visits
WHERE is_bot = 1
  AND (
    url = '/'
    OR url LIKE '/article/%'
    OR url LIKE '/articles/%'
    OR url LIKE '/courses/%.html'
    OR url LIKE '/courses/%/'
    OR url LIKE '/blogs/%.html'
    OR url = '/about/'
    OR url = '/archives/'
  )
ORDER BY visited_at DESC;
Check 3 — repeated IPs among bot marks. A bot proxy makes one request and disappears. A real user browses multiple pages. More than three marked rows from one IP is a signal, and the dashboard shows the sample URLs so the reader can see whether the IP was hitting tag pages (benign) or content pages (over-match).
SELECT ip_hash,
       COUNT(*) AS n,
       GROUP_CONCAT(DISTINCT url) AS sample_urls
FROM visits
WHERE is_bot = 1
  AND ip_hash IS NOT NULL
  AND ip_hash != ''
GROUP BY ip_hash
HAVING n > 3
ORDER BY n DESC;
Check 4 — hourly distribution of bot marks. A correctly-marked burst appears in one to four consecutive hour buckets. Marks scattered across the day mean the backfill over-matched, or a slow crawler has been marked across its full window.
SELECT strftime('%Y-%m-%d %H:00', visited_at, 'unixepoch') AS hour_utc,
       COUNT(*) AS marked
FROM visits
WHERE is_bot = 1
GROUP BY hour_utc
ORDER BY hour_utc DESC;
Check 5 — bot_reason breakdown. Every marked row carries a reason string, and the sum of all reasons should equal the banner total. A mismatch means rows were marked through a code path that was forgotten, or a code change renamed a reason.
SELECT COALESCE(bot_reason, '(null)') AS reason,
       COUNT(*) AS n,
       MIN(datetime(visited_at, 'unixepoch')) AS first_seen,
       MAX(datetime(visited_at, 'unixepoch')) AS last_seen
FROM visits
WHERE is_bot = 1
GROUP BY reason
ORDER BY n DESC;
The five queries total about forty lines of SQL. That is the entire correctness contract. The dashboard is not auditable because it is complicated — it is auditable because the audit is small enough to read.
What the dashboard deliberately omits
The dashboard is missing several things that a commercial analytics product would include. Each omission is deliberate.
•No session recording. No heatmaps, no scroll-depth tracking, no click-by-click replay. Those features require client-side telemetry that sends session data to a remote server. The whole point of this pipeline is that it does not do that.
•No real-time "who is on the site right now" view. The 5-minute window card is the closest thing. A live view would require persistent connections, which the system does not maintain. The trade is real-time for full auditability.
•No cross-page funnel analysis. The "Navigation Transitions" card in the Content tab gives a rough approximation, but real funnel analysis requires per-visitor identity that this system does not track. The visitor identifier is a hashed IP, not a cookie, and hashes cannot be joined across sessions the way cookies can.
•No dark mode. This is an aesthetic choice, not a privacy one. The cards are designed to be readable on light backgrounds because they are only opened when you want to investigate something specific. They are not a "keep this open on a second monitor all day" product.
•No mobile redesign. The dashboard is designed for a laptop screen. The tables scroll horizontally on mobile instead of reflowing. This is deliberate: the cards are read while debugging, and debugging happens on a full keyboard.
Every feature a commercial analytics product adds requires either more client-side tracking or more server-side state. Both are things this pipeline exists to avoid. The dashboard is minimal because the pipeline is minimal.
Using the dashboard as a debugging tool
The dashboard's primary use is not to answer "how is the site doing." It is to answer "why does the site's frontmatter count disagree with the database." There is a specific workflow for that.
1. Check the health card first. If the newest event is hours old and the site is live, the tracker is broken. Fix that before reading any other card.
2. Check the verify tool. If any check fails, the bot filter is wrong. Revert the false positives before investigating anything else. The reverts will flow through the corrections feed on the next sync.
3. Check the pending count. The Health tab has an "Unsynced Events" card. If it shows more than a handful of pending events, the last fetch_logs.sh run is out of date. Run it before comparing counts.
4. Compare the numbers. Take a specific article. Compare the Views: frontmatter value, the dashboard's clean total for that URL, and the local logs table's count for that URL. If all three agree, the pipeline is coherent. If they disagree, the pipeline has a state bug.
5. If they disagree, look at the markdown state. Query the local logs table for that URL. The markdown_counted column has four states: 0 (pending increment), 1 (counted), 2 (pending decrement), 3 (never counted or already decremented). If any rows are in state 0 or 2, the updater did not run. If all rows are in state 1 and the frontmatter is lower, the frontmatter was overwritten by something else.
SELECT markdown_counted, COUNT(*)
FROM logs
WHERE normalized_url = '/articles/static-site-search/'
  AND visitor_type = 'real'
  AND file_type = 'PAGE'
GROUP BY markdown_counted;
Six queries will resolve 90% of the "the counts disagree" scenarios. The remaining 10% require reading last_sync.json and the analytics log, both of which the dashboard surfaces with quick links from the Health tab.
The dashboard is the audit log, not the product
The mental model that makes this dashboard useful is: it is the audit log of the analytics pipeline, not the analytics product. The product is the count in the markdown frontmatter. The dashboard exists to verify that the count is correct.
That inverts the usual dashboard design. A commercial analytics dashboard optimizes for the first five seconds: the user opens the tab, sees a number, and closes the tab with a feeling. This dashboard optimizes for the sixth minute: the user notices that the frontmatter count is off by one, opens the dashboard, finds the cause, and closes the tab having fixed the pipeline.
A dashboard that cannot tell you why its own number is wrong is not an audit tool. It is a decoration.
The five tabs are five answers to that same question. Overview answers it before anything has gone wrong. Content and Engagement answer it when something specific is being investigated. Health answers it when something has already gone wrong. The verify tool is the specific mechanism that decides whether a mark is correct. That mechanism is what makes the dashboard a tool instead of a wall.
Conclusion
An analytics dashboard is the most-often-built and least-often-audited component of a self-hosted system. The tracking code gets audited because it is where the security surface is. The sync pipeline gets audited because it is where the file writes are. The dashboard gets opened, trusted, and never questioned.
The design in this article inverts that. The dashboard is the audit layer. Every card declares its window and its source. Every card reads from the same clean view. The anomaly panel reads from the raw table specifically because it needs to see what the clean view hides. The verify tool runs five checks against the bot-marked set and exposes scoped reverts for each failing check. The health card tells you whether the database is growing, shrinking, or fresh.
None of this makes the dashboard attractive. It makes it defensible. If you are building analytics for a personal site, the question is not "how do I make the numbers go up." It is "how do I know the numbers are right." The five tabs are one answer to that question.
The follow-up to this article would be about the tools that sit between the dashboard and the pipeline: the backfill tool that retroactively marks bots, the revert scopes that fix the marks it gets wrong, and the sync that carries both through to the published site. Those are the third leg of the pipeline. The dashboard is where you see the pipeline; the tools are where you correct it.
Recent Articles





Most Viewed Articles





The Ultimate Vim Setup (My 2024 vimrc ) : Essential Commands, Configurations, and Plugin Tips
Views: 1.49K
12 Apr 2024

Complete Tutorial: Creating Categories and Subcategories Using Pages in Pelican
Views: 1.14K
24 Jun 2025
Leave a comment