Tableau de variations, de signe et concavité avec Tkz-Tab package 2
📅 November 15, 2025 | 👁️ Views: 1
\documentclass[12pt]{article}
\usepackage[left=1cm,right=1cm,top=1cm,bottom=1cm]{geometry}
\usepackage{tkz-tab}
\usepackage{amsmath}
\usepackage{xcolor}
\usetikzlibrary{calc}

\begin{document}

%================ Sign Table =================%
\begin{center}
\begin{tikzpicture}
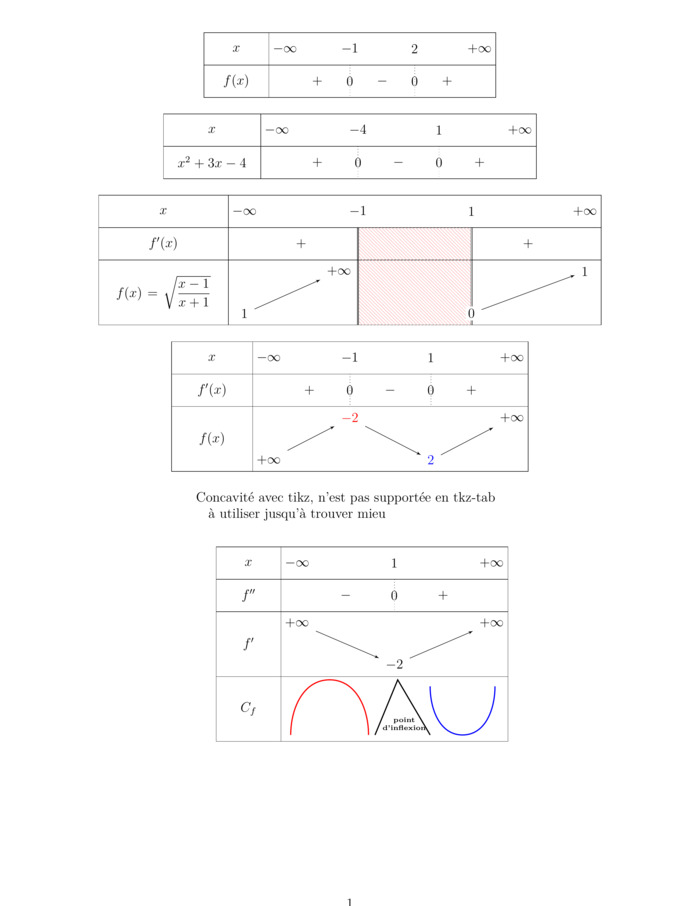
    \tkzTabInit[lgt=2,espcl=2]%
        {$x$ /1 , $f(x)$ /1}%
        {$-\infty$, $-1$, $2$, $+\infty$}
    \tkzTabLine{ , + , z , - , z , + , }
\end{tikzpicture}
\end{center}

\begin{center}
 \begin{tikzpicture}
    \tkzTabInit[lgt=3,espcl=2.5]%
        {$x$ /1 , $x^2 + 3x - 4$ /1}%
        {$-\infty$, $-4$, $1$, $+\infty$}%

    \tkzTabLine{ , + , z , - , z , + , }
\end{tikzpicture}

\end{center}

\begin{center}
  \begin{tikzpicture}
       \tikzset{h style/.style = {pattern = north west lines,
            pattern color = red!30}}
   \tkzTabInit[lgt=4,espcl=3.5]
     {$x$ / 1 , $f'(x)$ / 1, $f(x)=\sqrt{\dfrac{x-1}{x+1}}$ / 2 }
     {$-\infty$, $-1$, $1$, $+\infty$}
   \tkzTabLine
     { , + , d , h , d, +, }
   \tkzTabVar
     { -/1 , +DH/$+\infty$, -C/0, +/1}
  \end{tikzpicture}
\end{center}

%================ Variation Table =================%
\begin{center}
\begin{tikzpicture}
\tkzTabInit[lgt=2.5,espcl=2.5]%
    {$x$ /1 , $f'(x)$ /1 , $f(x)$ /2}%
    {$-\infty$, $-1$, $1$, $+\infty$}
\tkzTabLine{ , + , z , - , z , + , }
\tkzTabVar{
    -/ $+\infty$ ,
    +/ {\textcolor{red}{$-2$}} ,
    -/ {\textcolor{blue}{$2$}} ,
    +/ $+\infty$
}
\end{tikzpicture}
\end{center}


%================ Concavity Table =================%
\begin{center}
\begin{tikzpicture}
\node[align=left] at (4,1.5) {Concavité avec tikz, n'est pas supportée en tkz-tab};
\node[align=left] at (2.5,1) {à utiliser jusqu'à trouver mieu};
\tkzTabInit{$x$ /1, $f''$ /1,$f'$ /2, $C_f$ /2}{$-\infty$ , $1$ ,$+\infty$}
\tkzTabLine{, - , z , + ,}
\tkzTabVar{+/$+\infty$ , -/$-2$ , +/$+\infty$}
\begin{scope}[line width=1pt]
    % le point N14 est définie dans le packet tkz-tab
    % on décine des courbes avec la command "to"
    % [out=90,in=180] : le debut de la courbe à un angle 90
    % vers la droite et fini avec un angle horizontal (sommet de la courbe) à 180
    % à une hauter de 1.9 (ajouté à y)
    % puis en descend, le début 0 degré et la fin 90 degrés
    \draw[red] ($(N14)+(-0.2,0.2)$) to [out=90,in=180] ($(N14)+(1,1.9)$)
        to [out=0,in=90] ($(M14)+(0.7,0.2)$) coordinate (A);
    \draw ($(A)+(0.2,0)$) -- ++(0.7,1.7) coordinate (B)  -- ++(1,-1.7);
    % debut -90 degrés, fin 180 horizontal en bas.
    \draw[blue] ($(B)+(1,-0.2)$) to [out=-90,in=180] ($(B)+(2,-1.7)$)
        to [out=0,in=-90] ($(B)+(3,-0.2)$) coordinate (C);
    \node[below, text width=2cm, align=center, font=\tiny\bf] at ($(B)+(0.2,-1)$) {
       point \\d'inflexion
    };

\end{scope}
\end{tikzpicture}
\end{center}
\end{document}
Related Courses, Exams, and Exercises
- Tableau de concavité avec Tikz Course
- Tableau de signe d'une inégalité trigonométriques avec tikz Course
- Tableau de variations avec Tikz Course
- Tableau de variations avec Tkz-Tab package Course
Course PDF:
📥 Download Tableau de variations, de signe et concavité avec Tkz-Tab package 2 (PDF)
if you find this content helpful, Please consider supporting me with a small donation
إن وجدت هذا المحتوى مفيدا، من فضلك إدعمني بمبلغ بسيط كتبرع
Buy me a coffee — إشتر لي قهوة
PayPal.me • عبر بايبالOr bank transfer • أو حوالة بنكية
Titulaire : RADOUAN MOSAID
RIB : 230 090 6501953211022000 65
IBAN : MA64 2300 9065 0195 3211 0220 0065
BIC / SWIFT : CIHMMAMC
Most Viewed Courses
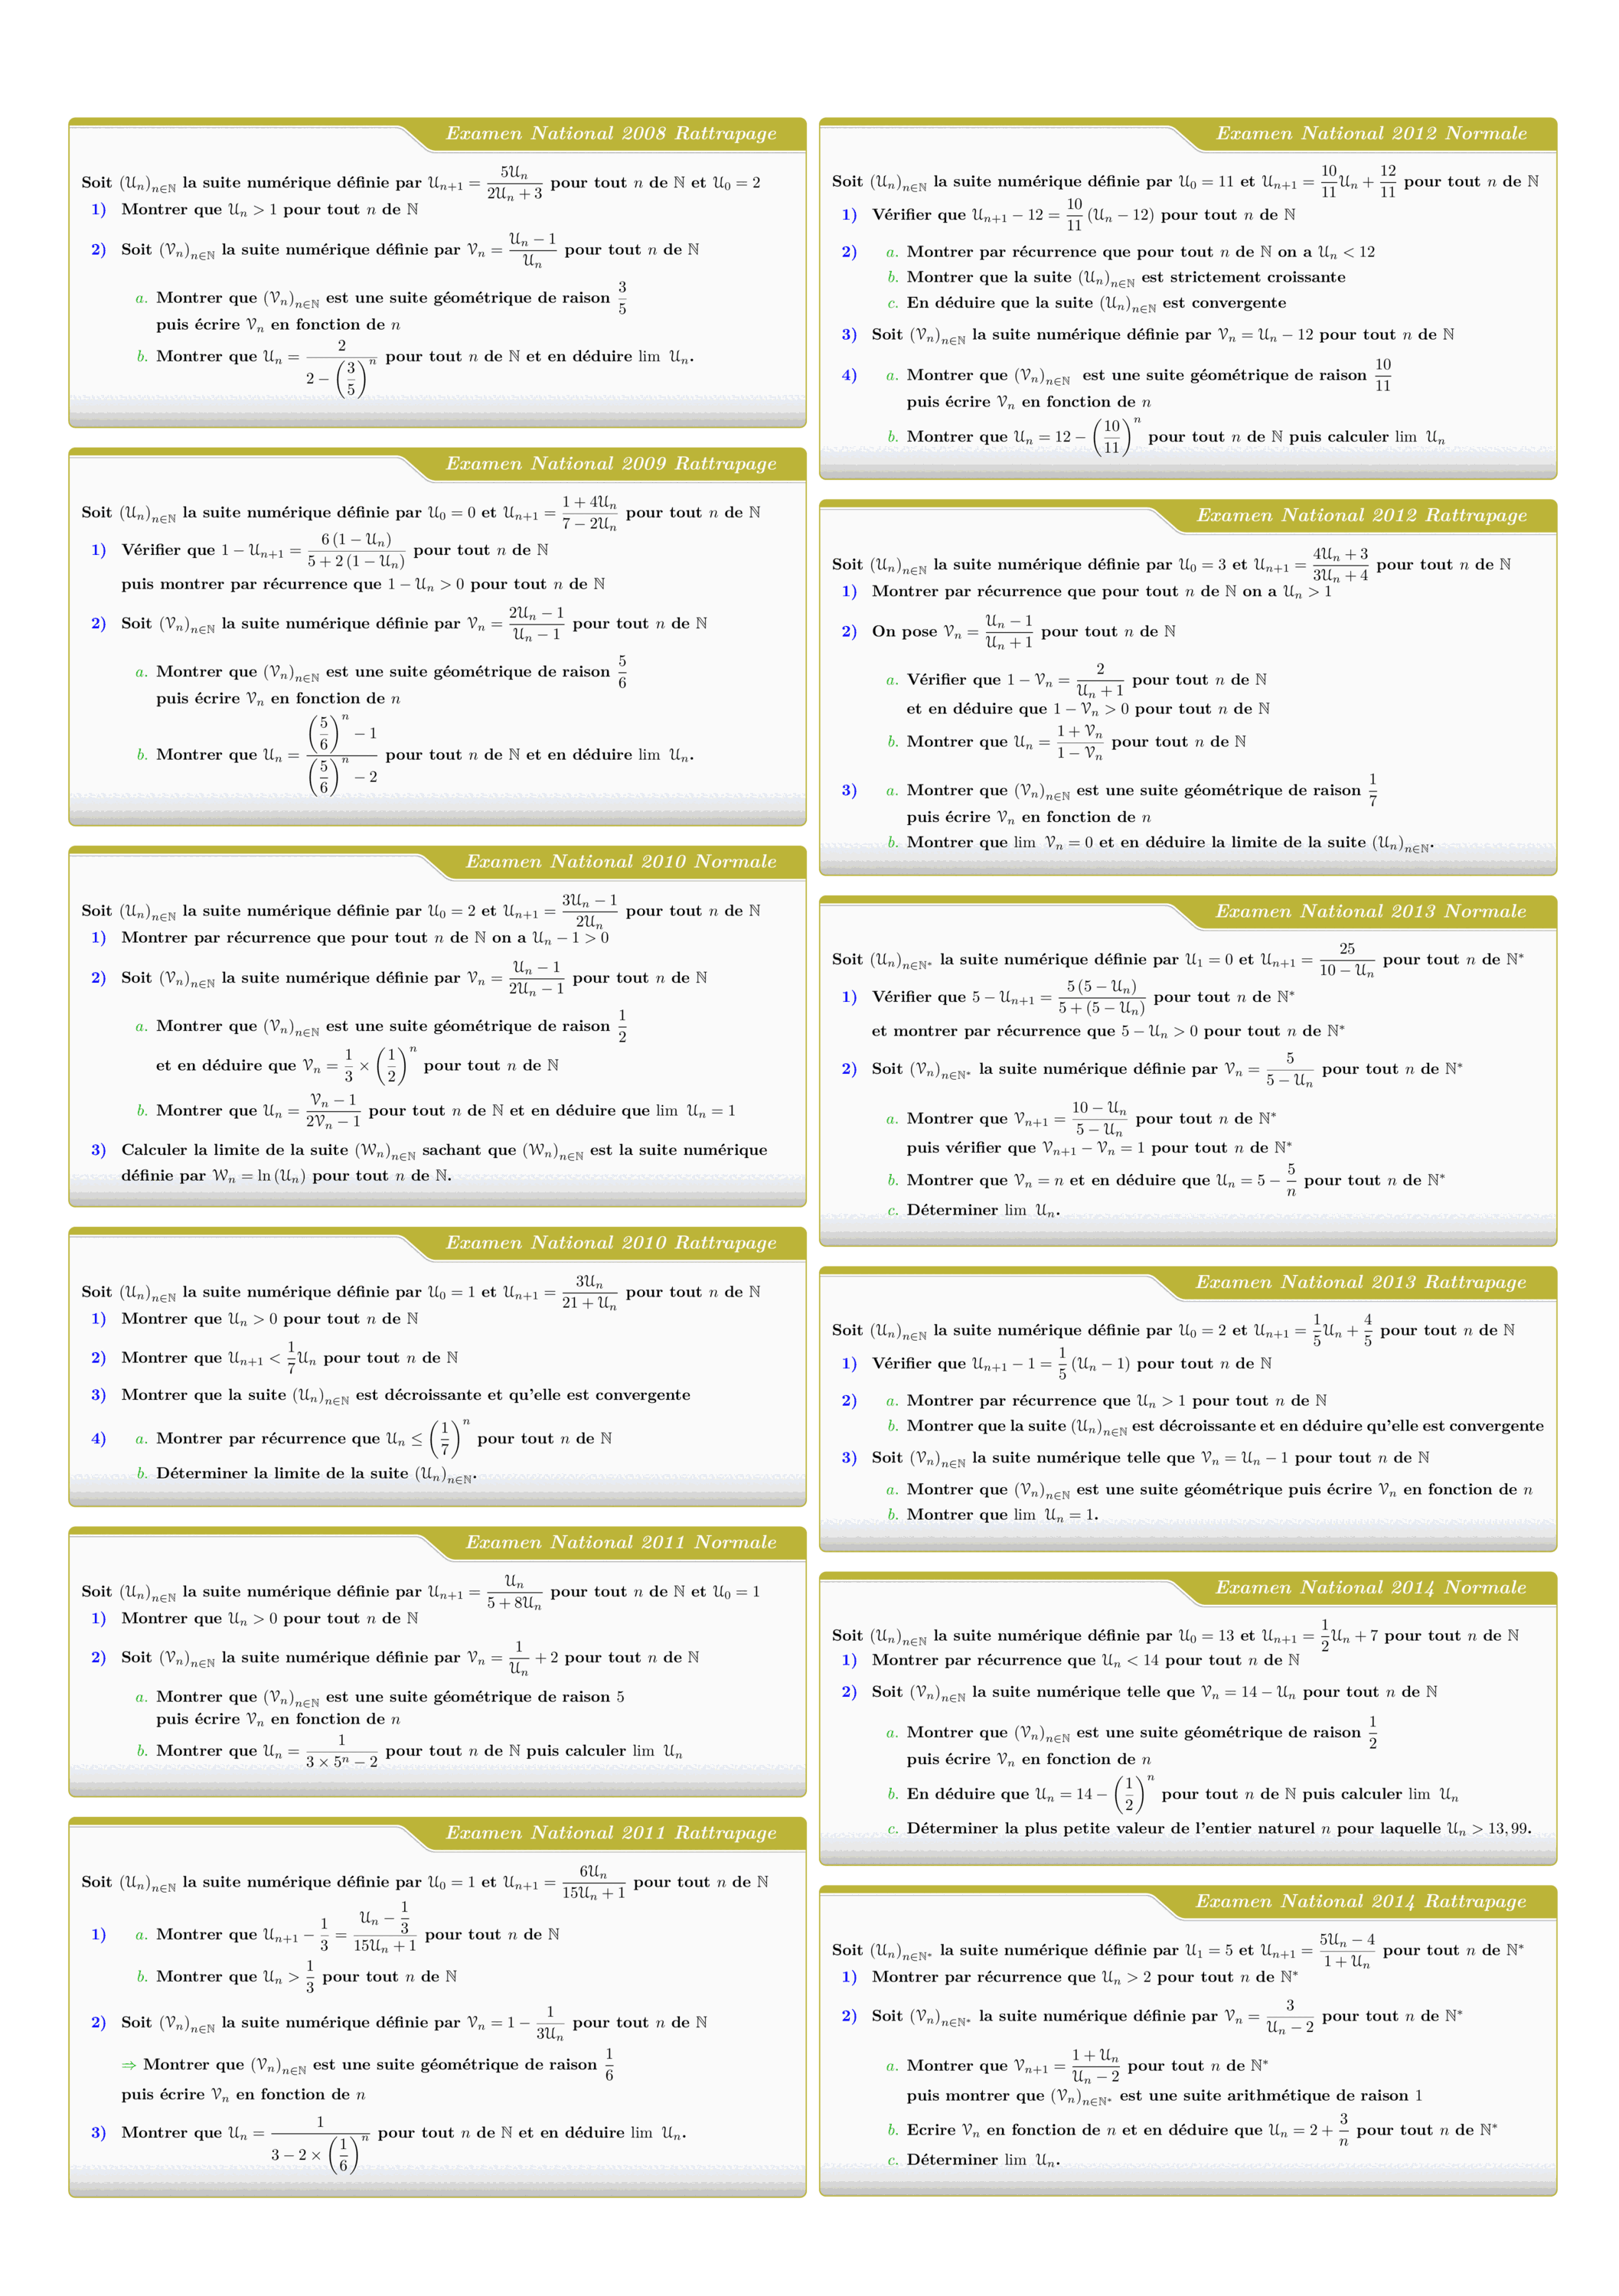
Tous les sujets des suites numériques des examens nationaux 2008 - 2022
Views: 1.90K
Exam • Maths • 2 Bac Science
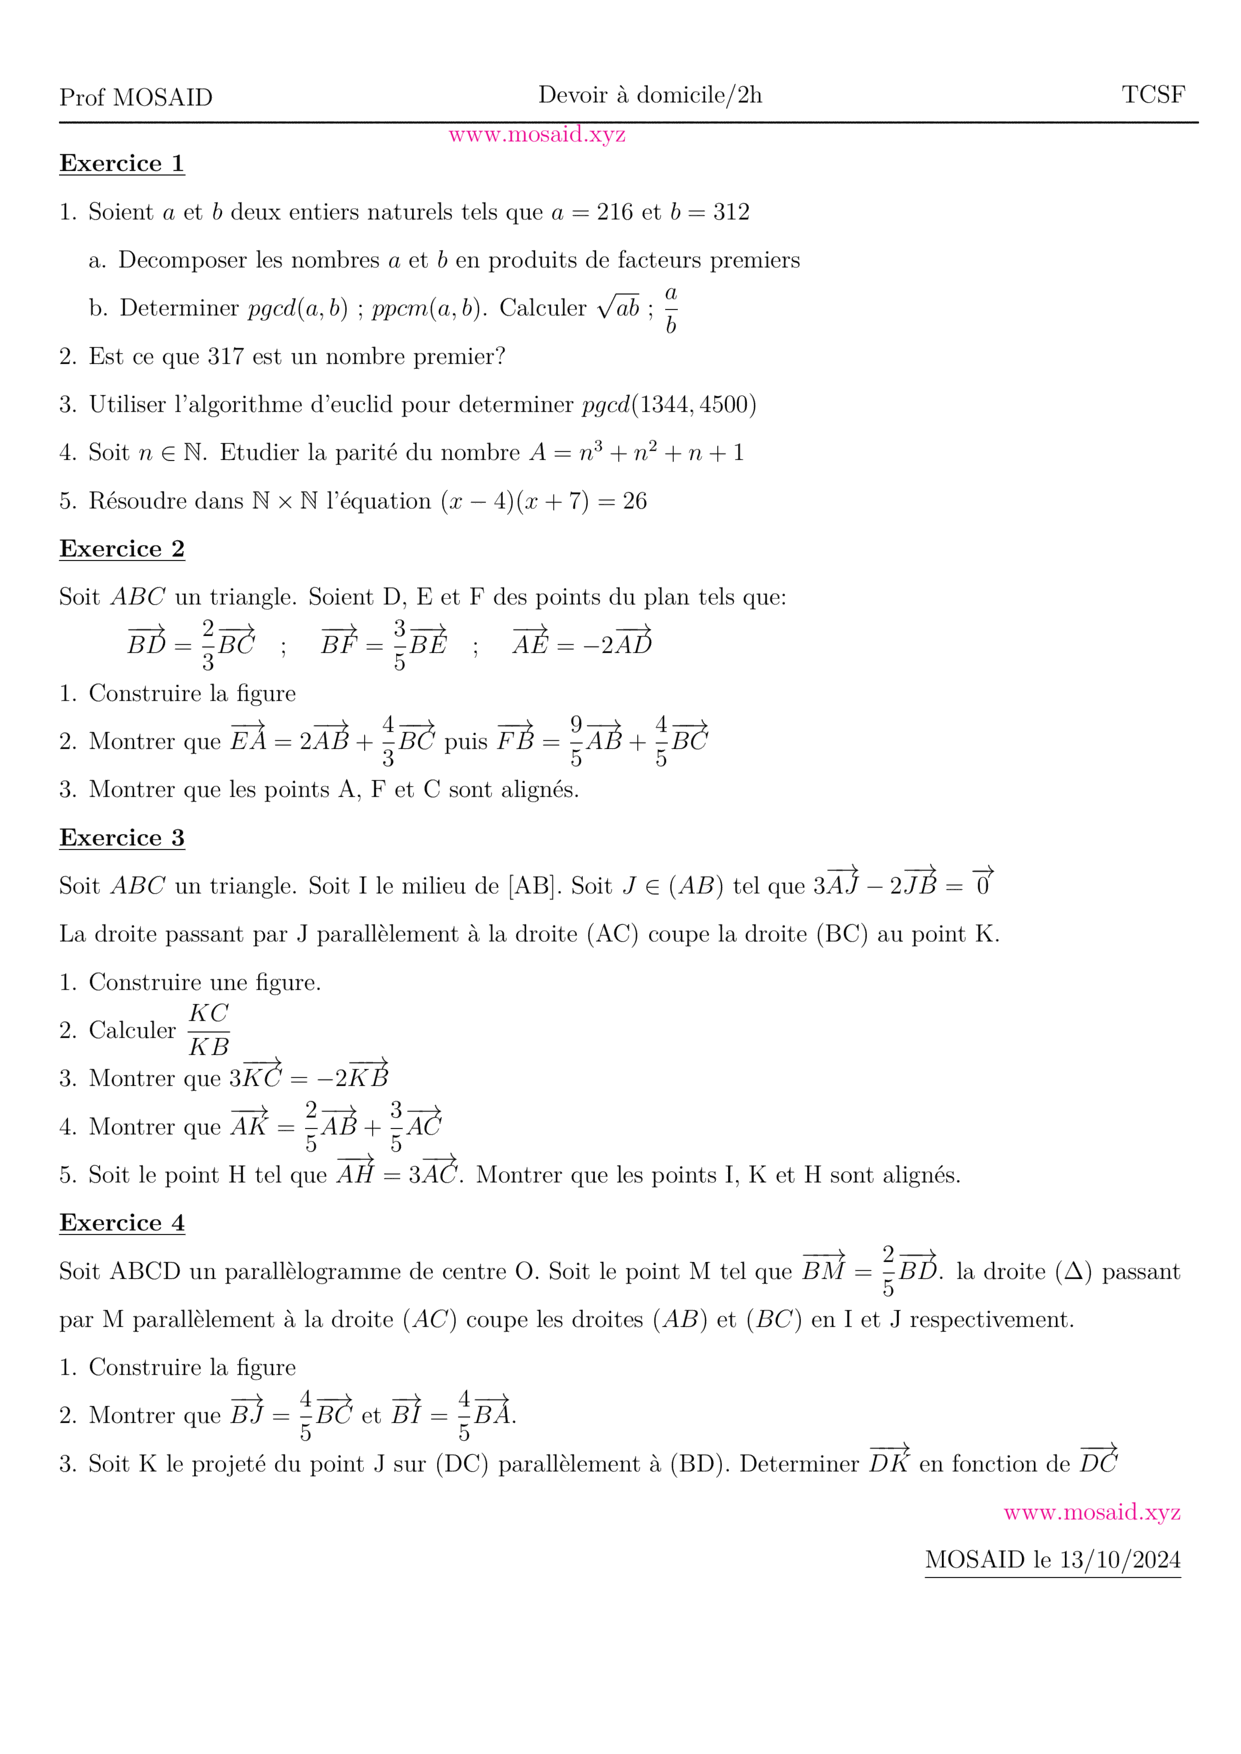
DM 1 - Arithmetiques, Calcul vectoriel et projection
Views: 1.67K
Exam • Maths • Tronc Commun Sciences
MATHEMATIQUES Examens nationaux 2003-2021 2 Bac.Sciences expérimentales
Views: 1.65K
Exam • Maths • 2 Bac Science
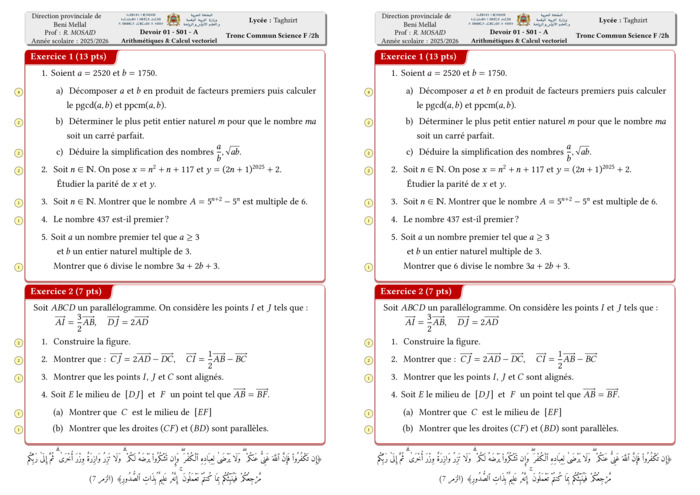
Control 01 S01 En arithmétiques et Calcul vectoriel - A 2025-2026
Views: 1.65K
Exam • Maths • Tronc Commun Sciences
Recent Articles

Boosting LaTeX Editing with Custom Vim Mappings
23 Nov 2025
