This article is a continuation of the previous one, last time we created horizontal asymptotes, in this article I am going to show you how to draw an oblique asymptote.
What is an Oblique Asymptote?
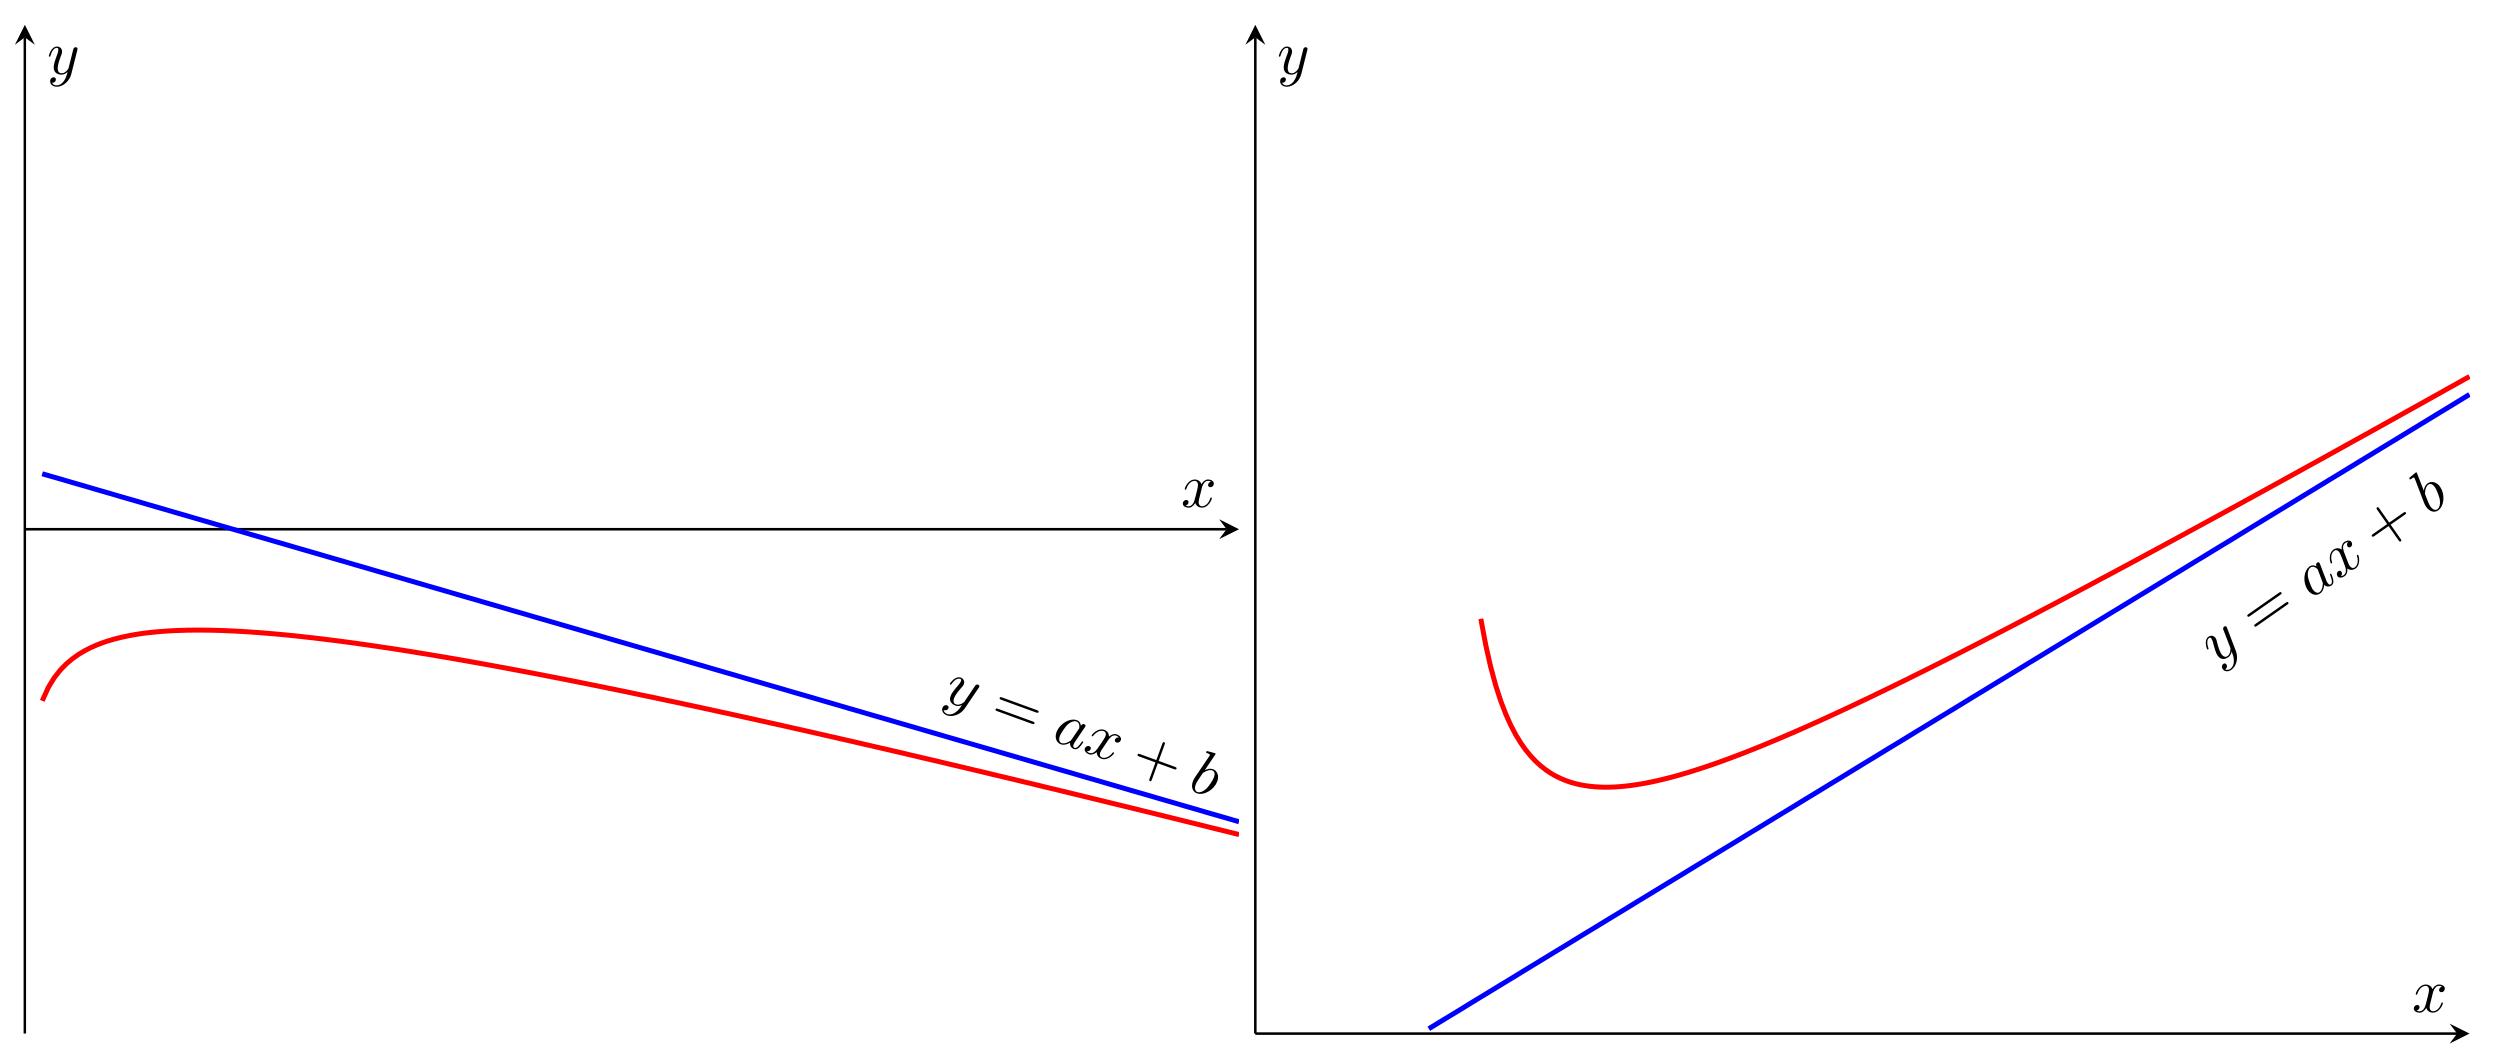
An oblique asymptote is a straight line that a function approaches as x approaches infinity or negative infinity. Unlike horizontal or vertical asymptotes, oblique asymptotes have a non-zero slope and are therefore inclined. Oblique asymptotes occur when the degree of the numerator is one more than the degree of the denominator.
Drawing an Oblique Asymptote with TikZ
Just like in the previous article we need to include the necessary packages first, to plot and draw graphs you need Tikz and pgfplots packages.
\standaloneconfig{border=2mm 2mm 2mm 2mm}
\usepackage{pgfplots}
\pgfplotsset{compat=1.18}
\begin{document}
\begin{tikzpicture}[scale=0.50]
    \begin{axis}[axis lines=center,
	xlabel={$x$},
	ylabel={$y$},
	xtick=\empty,ytick=\empty,
	xmin=0,xmax=7,
	ymin=0,ymax=10,
	unbounded coords=jump,
	samples=200]
	\addplot [red,thick,domain=1.3:7,unbounded coords=jump]
	{x-1+1/(ln(x))};
	\addplot [blue,thick,domain=1:7,unbounded coords=jump]
	{x*1.048-1};
	\node[rotate=35,below] at (6,5) {$y=ax+b$};
     \end{axis}
\end{tikzpicture}
In this example, we're plotting the function f(x)=x-1+1/(ln(x)) in red, and the oblique asymptote y=x*1.048-1 in blue. To find the equation of the oblique asymptote, we need to calculate:
lim (f(x) / x) = a
x->+∞
for this particular function we find that a=1 and to find the y-intercept we calculate:
lim (f(x) - ax) = b
x->+∞
To plot the oblique asymptote, we use the \addplot command with the equation x*1.048-1, where 1.048 (changed a little to make it visually appealing) is the slope of the oblique asymptote . We've also added a rotated node to the plot to label the equation of the oblique asymptote.
Conclusion
Drawing oblique asymptotes with TikZ in LaTeX is a straightforward process that can help you gain a better understanding of the behavior of your functions. By following the steps outlined in this tutorial, you can create professional-looking mathematical graphs and plots with ease.
Related Articles


Most Recent Articles

Most Viewed Articles


0 Comments, latest
No comments.