How to Draw Horizontal Asymptotes Using LaTeX TikZ: A Step-by-Step Guide
Category: Latex
Date: April 2023
Views: 498
Hello readers, in the previous article we created vertical asymptotes using Tikz. today we are going to explore the power of TikZ yet again to create horizontal asymptotes, and as usual I will give you the full working Latex code in my examples. so let's dig in.
As usual, before we start we must prepare the necessary packages to use tikz:
\standaloneconfig{border=2mm 2mm 2mm 2mm}
\usepackage{pgfplots}
\pgfplotsset{compat=1.18}
\begin{document}
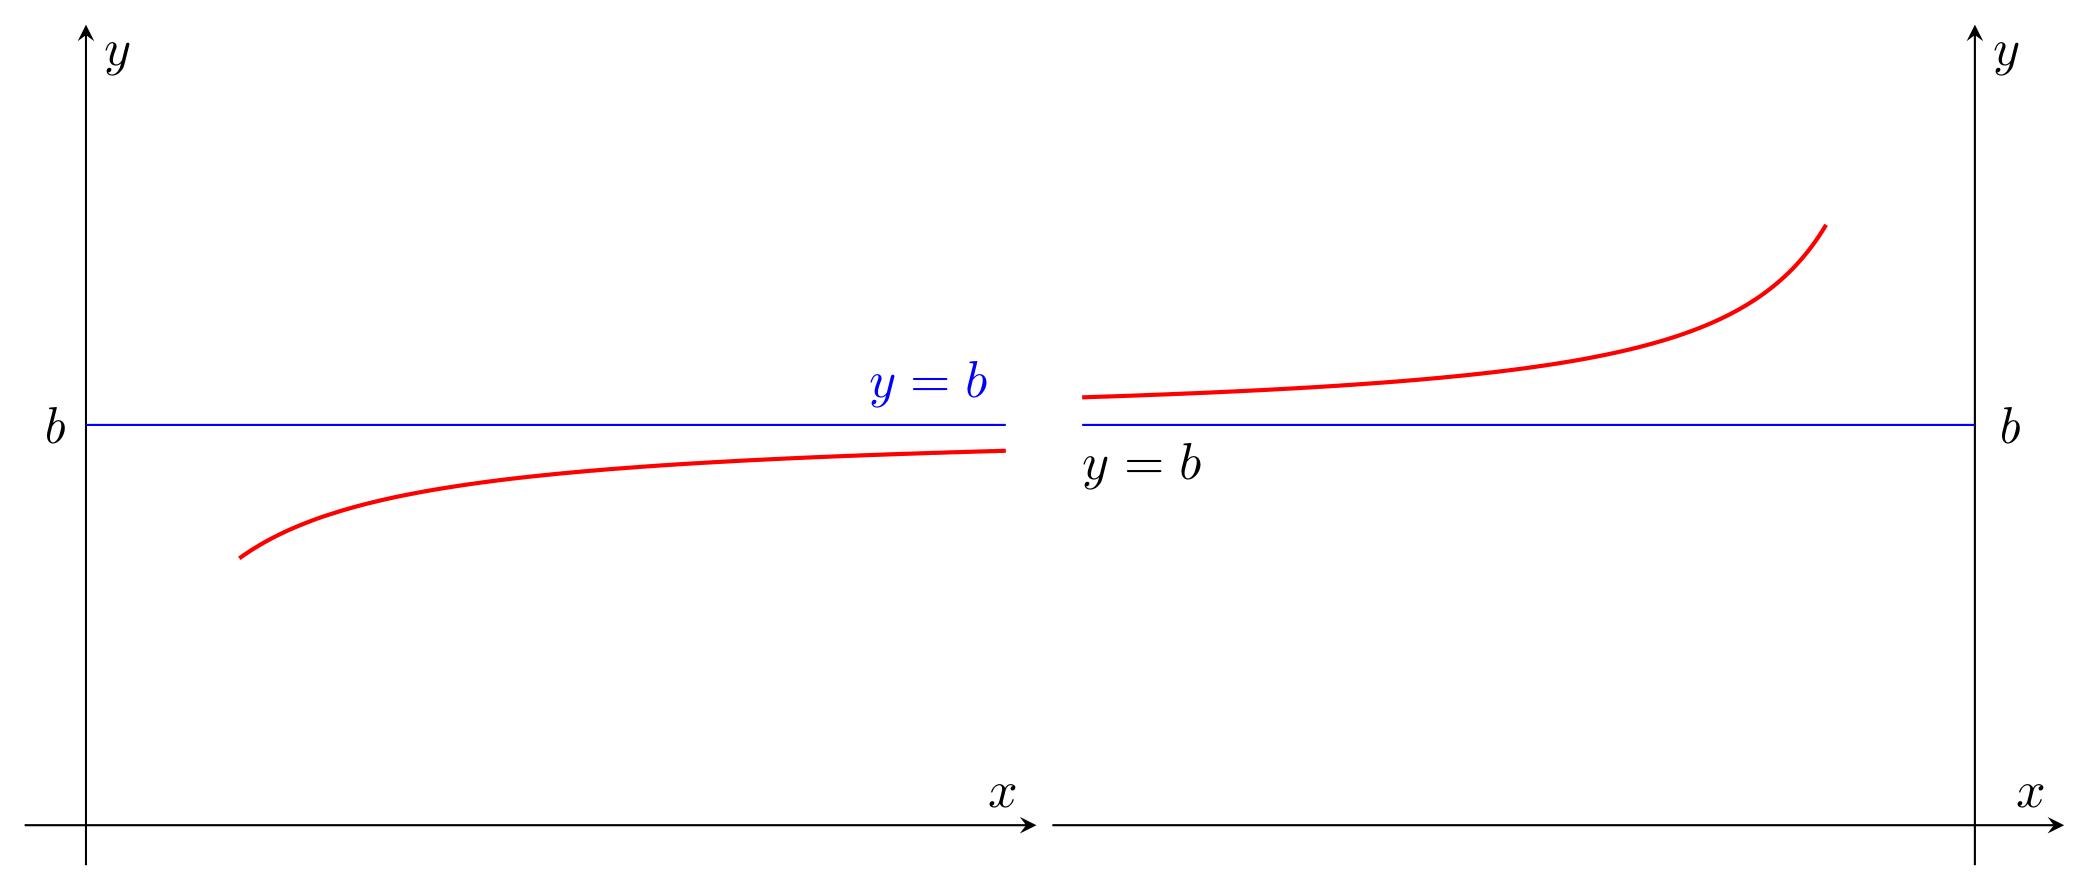
The first example is a graph that has a horizontal asymptote. This is a type of line that the graph approaches but never touches. To create this graph in TikZ, we use the "axis" environment, which is a powerful tool for creating graphs.
\begin{tikzpicture}[scale=0.50]
    \begin{axis}[axis lines=center,
	xlabel={$x$},
	ylabel={$y$},
	xtick=\empty,ytick=\empty,
	xmin=-1,xmax=21,
	ymin=-0.2,ymax=5,
	unbounded coords=jump,
	samples=200]
	\addplot [red,thick,domain=2.5:20,unbounded coords=jump] {(3+x)/(x-1)};
	\addplot[blue] coordinates {(0,1.1) (20,1.1)} node[below left]{$y=b$};
	\node[left] at (-0.1,1.2) {\textit{b}};
     \end{axis}
\end{tikzpicture}
In the code example, we set the axis limits, x and y labels, and tick marks. Then we define the function we want to plot using the "addplot" command. The red line represents the graph of the function, and the blue line represents the horizontal asymptote. Finally, we add a label to the blue line using the "node" command.
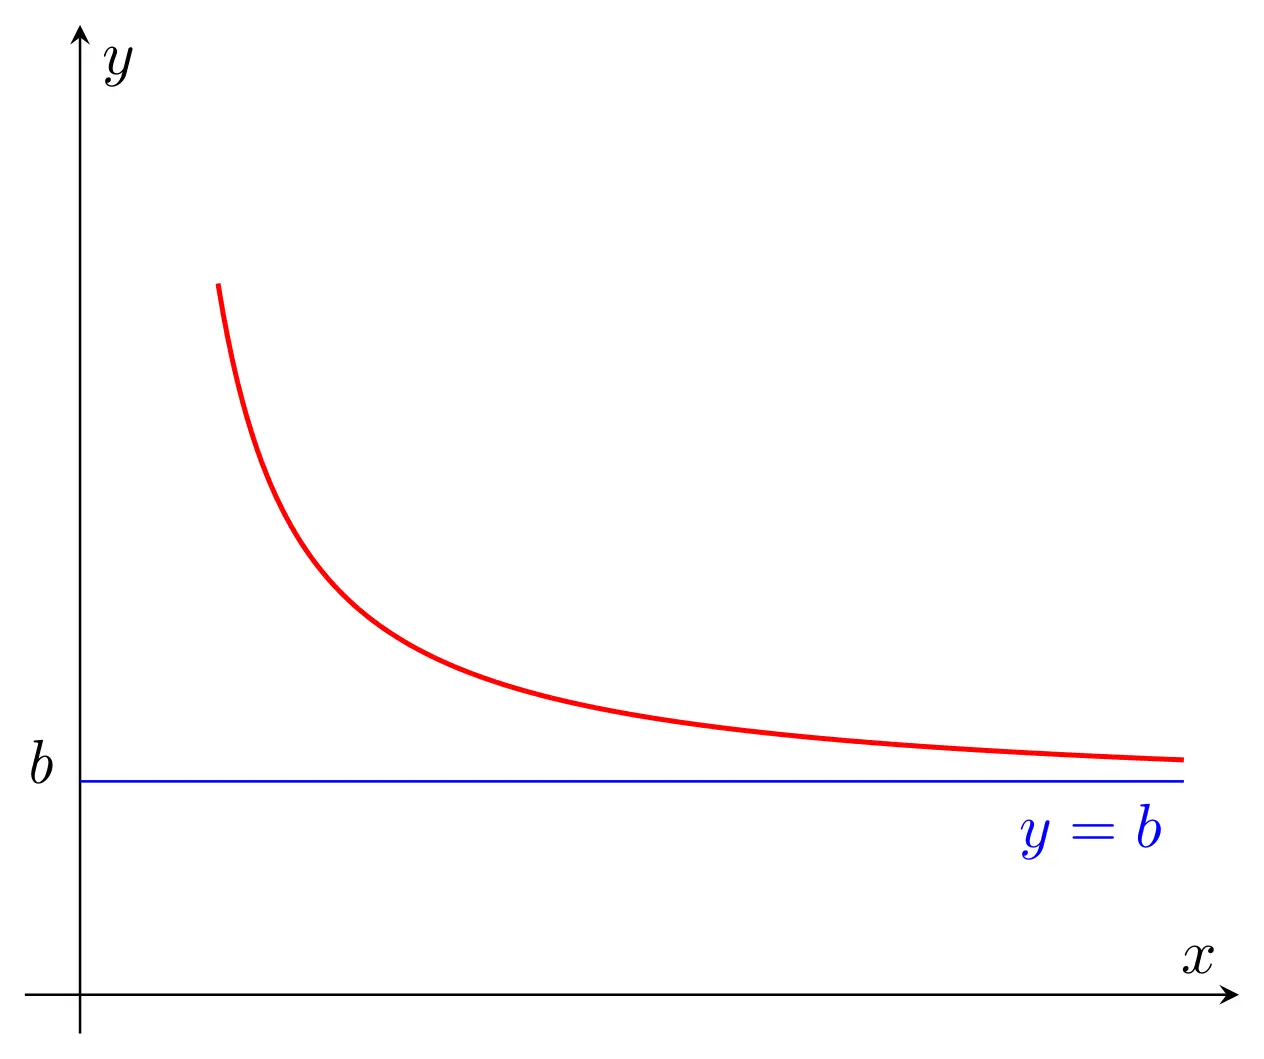
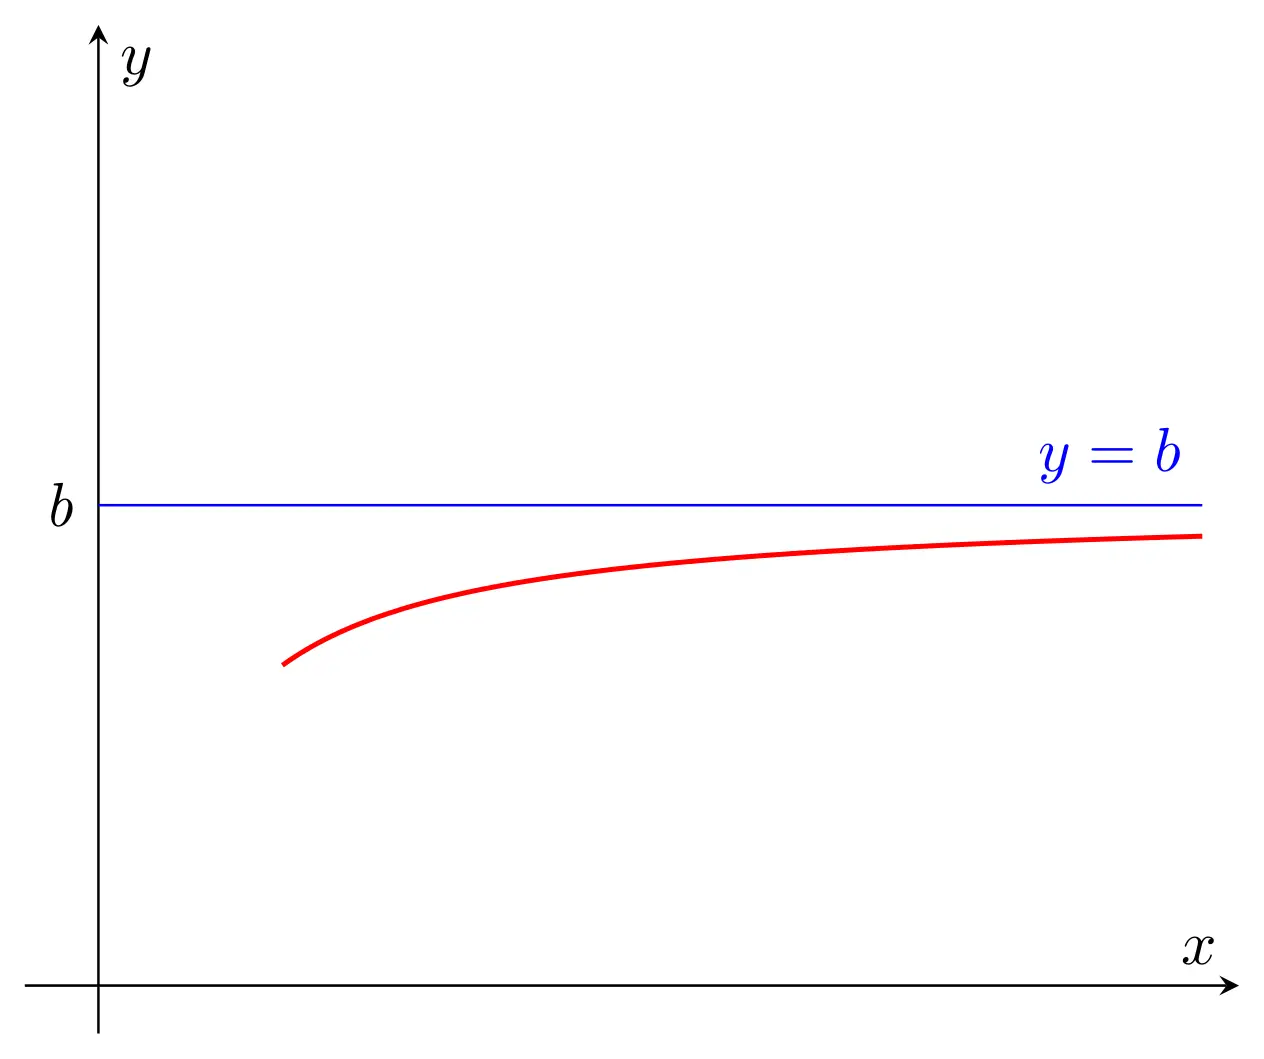
Now let's move on to the second example, which is a graph with another type of horizontal asymptote. The process of creating this graph is similar to the first one, but this time the asymptote is located at a different y-value. We also need to adjust the domain of the function to make sure we get the correct graph.
\begin{tikzpicture}[scale=0.50]
    \begin{axis}[axis lines=center,
	xlabel={$x$},
	ylabel={$y$},
	xtick=\empty,ytick=\empty,
	xmin=-2,xmax=31,
	ymin=-0.1,ymax=2,
	unbounded coords=jump,
	samples=200]
	\addplot [red,thick,domain=5:30,unbounded coords=jump] {2+(3+x)/(-x-1)};
	\addplot[blue] coordinates {(0,1) (30,1)} node[above left]{$y=b$};
	\node[left] at (-0.1,1) {\textit{b}};
     \end{axis}
\end{tikzpicture}
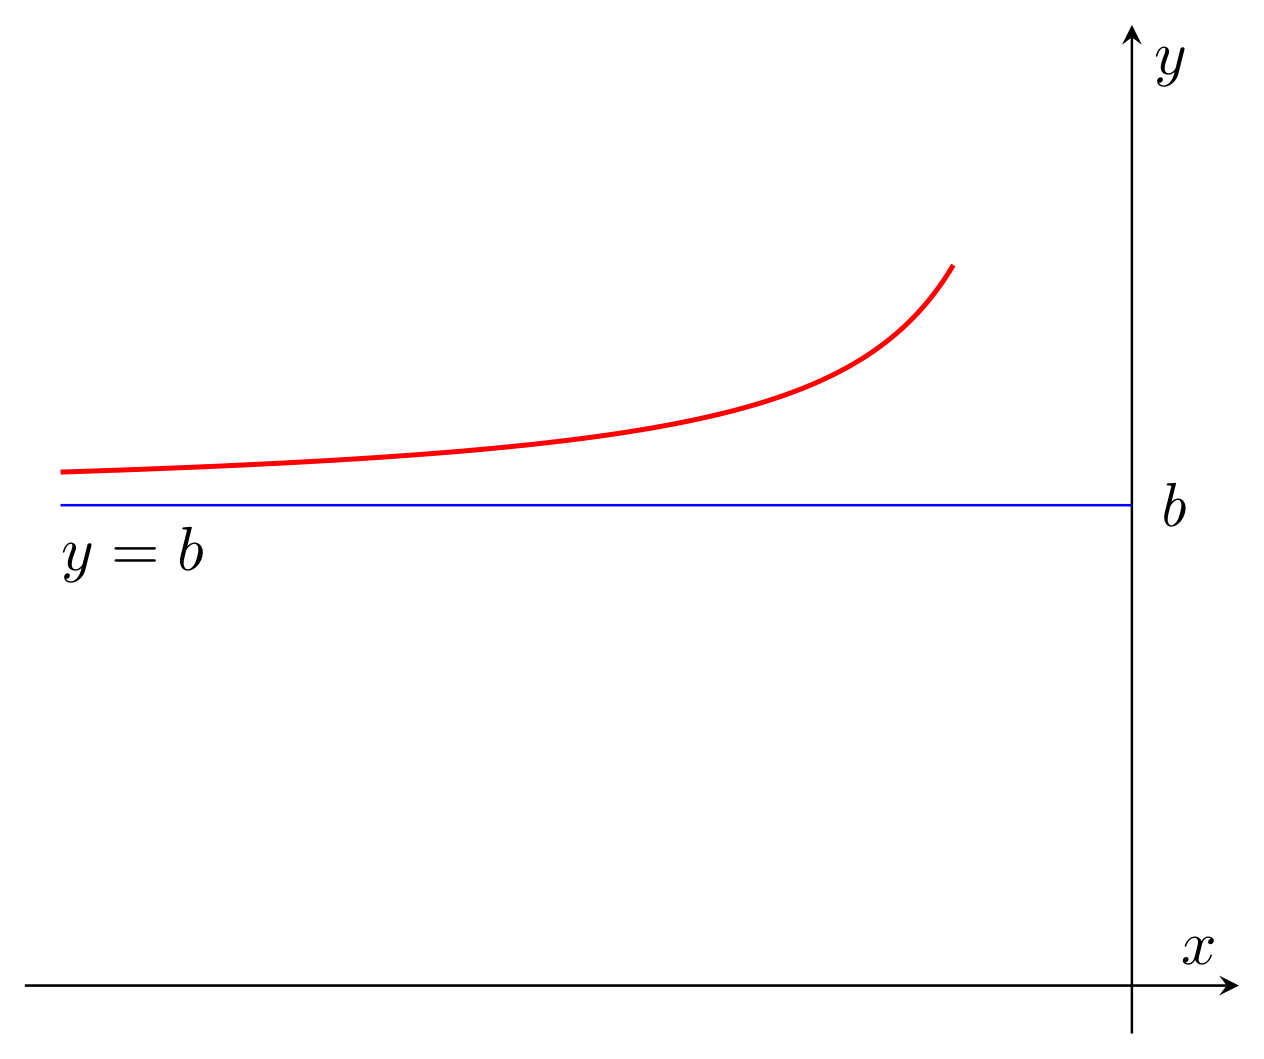
Finally, we have a third example that is similar to the second one, but with the asymptote located on the left-hand side of the graph. To achieve this, we adjust the domain of the function once again, and place the label for the asymptote on the left side using the "node" command.
\begin{tikzpicture}[scale=0.50]
    \begin{axis}[axis lines=center,
	xlabel={$x$},
	ylabel={$y$},
	xtick=\empty,ytick=\empty,
	xmin=-31,xmax=3,
	ymin=-0.1,ymax=2,
	unbounded coords=jump,
	samples=200]
	\addplot [red,thick,domain=-30:-5,unbounded coords=jump] {2+(3+x)/(-x-1)};
	\addplot[blue] coordinates {(-30,1) (0,1)} ;
	\node[below] at (-28,1) {$y=b$};
	\node[right] at (0.1,1) {\textit{b}};
     \end{axis}
\end{tikzpicture}
Now that we've gone through these examples, I encourage you to try them out yourself and experiment with different functions and parameters. TikZ is a powerful tool that can help you create amazing graphics and diagrams, and with practice, you can create complex and beautiful visualizations. Remember to have fun and be creative with your graphs!
In conclusion, TikZ is a great package for LaTeX users who want to create beautiful graphics and diagrams. In this post, we explored some examples of graphs with horizontal asymptotes, and saw how the "axis" environment, "addplot" command, and "node" command can be used to create these graphs. I hope this post has been helpful, and I encourage you to continue exploring TikZ and all the amazing things you can create with it.
Related Articles


Most Recent Articles


Most Viewed Articles


0 Comments, latest
No comments.