Create Stunning LaTeX Figures with GeoGebra: Step-by-Step Tutorial
Category: Latex
Date: 8 months ago
Views: 806
Introduction
In this article, I'll guide you through the process of using GeoGebra to generate LaTeX TikZ figures, empowering you to create high-quality mathematical illustrations for your documents and presentations. GeoGebra is a versatile tool widely used by educators, researchers, and professionals for its intuitive interface and powerful features in geometry, algebra, calculus, and more. LaTeX TikZ, on the other hand, is a popular package for generating vector graphics directly within LaTeX documents, offering precise control over figure design and layout.
By harnessing the capabilities of GeoGebra and seamlessly integrating them with LaTeX TikZ, you can produce visually appealing mathematical figures that enhance the clarity and impact of your work. Whether you're a student writing a report, a researcher preparing a paper, or a teacher creating educational materials, mastering this combination of tools will significantly elevate the quality of your mathematical illustrations.
Exporting Figures to LaTeX TikZ
To incorporate your GeoGebra figures into LaTeX documents, you can export them to TikZ format following these steps:
1. Exporting from GeoGebra:
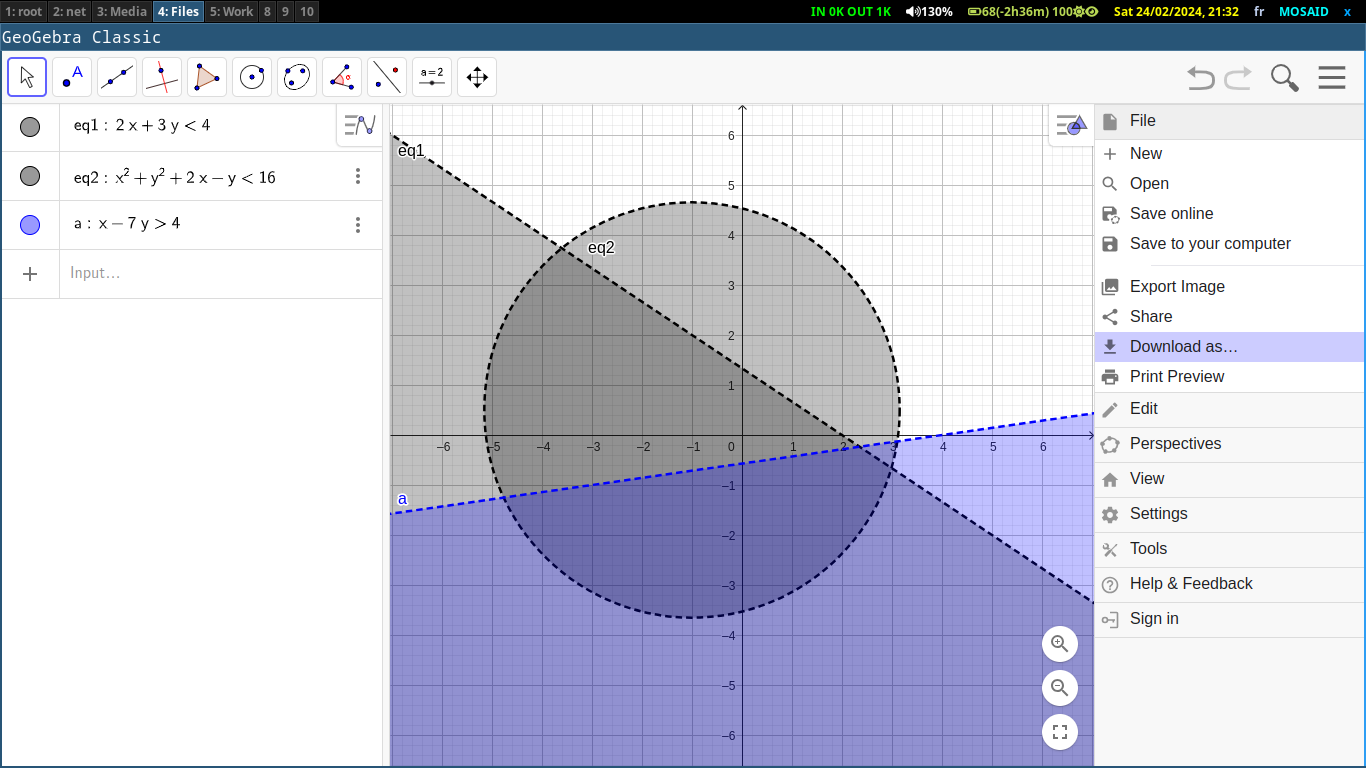
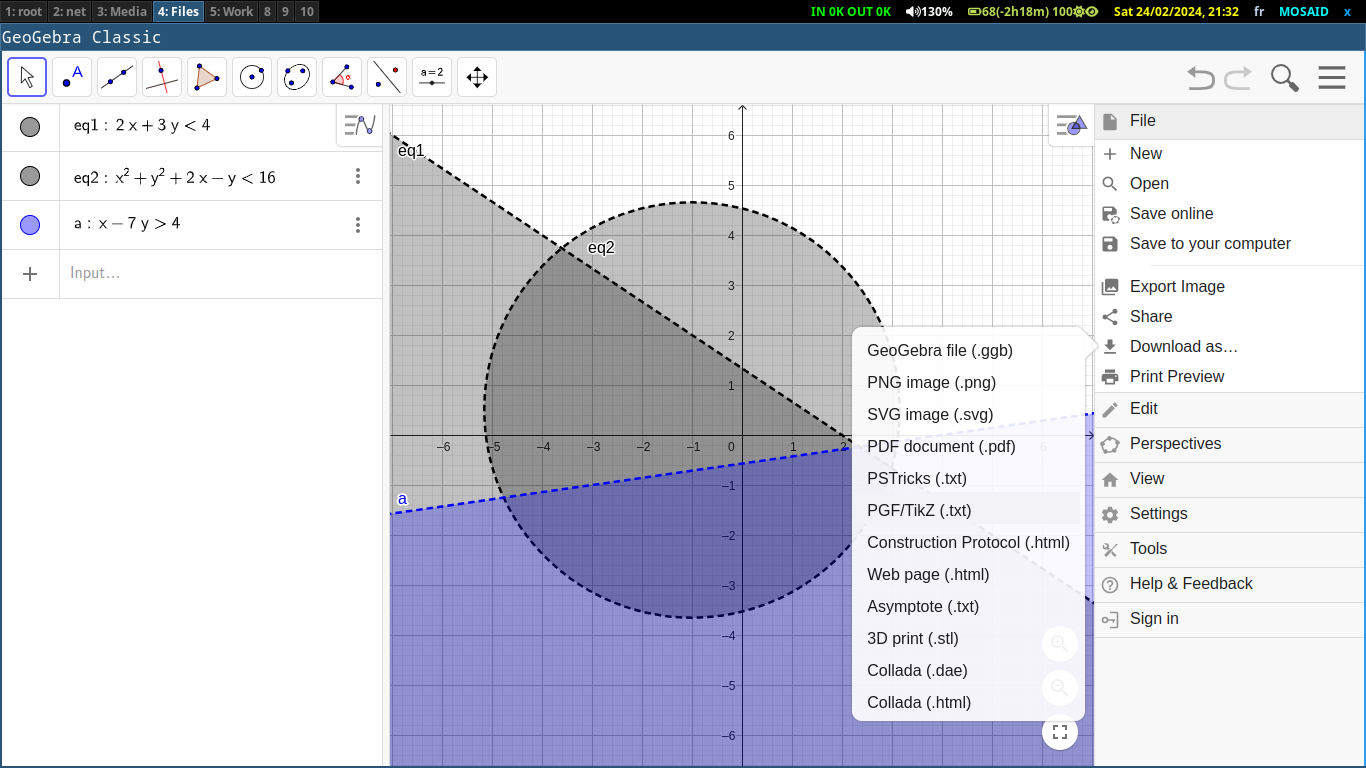
In GeoGebra, select the figure you want to export and navigate to the "File" menu. Choose the "Download as" option, then select "PGF/TikZ." Save the exported TikZ code to a file with a .tex extension.
2. Integrating into LaTeX Documents:
In your LaTeX document, use the \begin{tikzpicture}...\end{tikzpicture} environment to embed the TikZ code. You may need to adjust the code or add additional LaTeX packages depending on your document's requirements.
By exporting figures from GeoGebra to LaTeX TikZ, you can seamlessly integrate dynamic mathematical illustrations into your LaTeX documents.
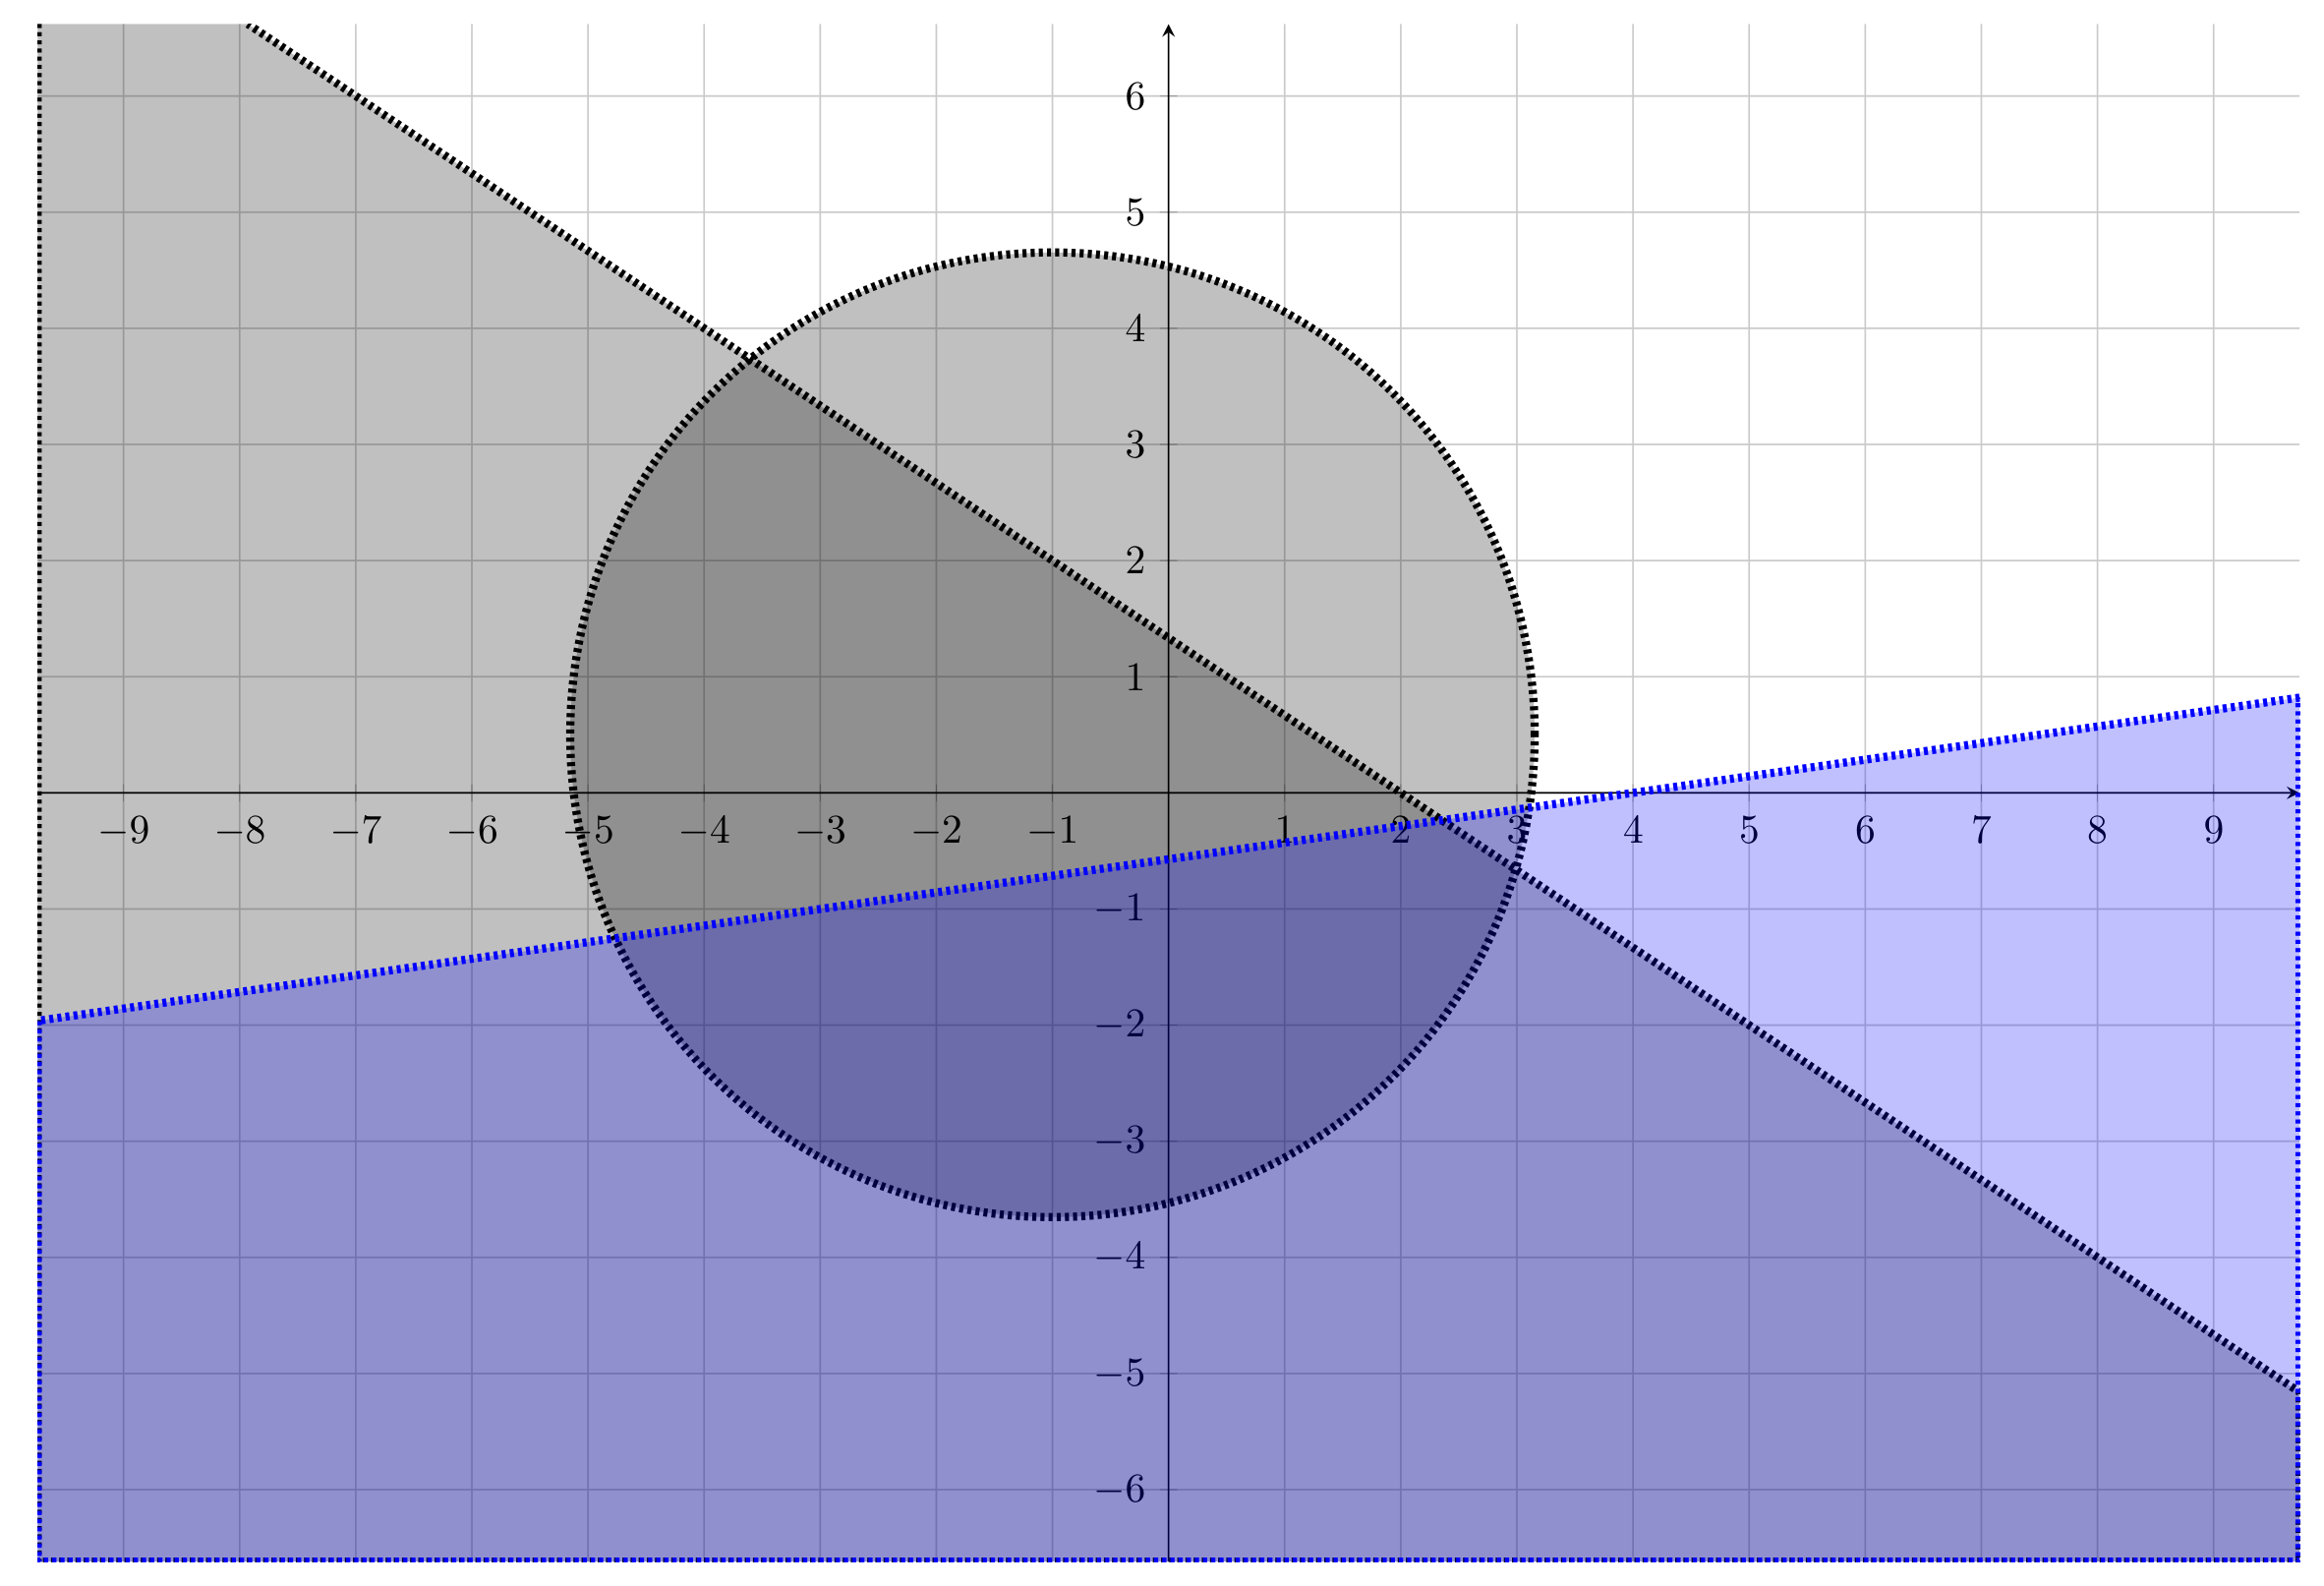
the above figure rsults in the following LaTeX TikZ code:
\documentclass[10pt]{article}
\usepackage{pgfplots}
\pgfplotsset{compat=1.15}
\usepackage{mathrsfs}
\usetikzlibrary{arrows}
\pagestyle{empty}
\begin{document}
\definecolor{qqqqff}{rgb}{0,0,1}
\begin{tikzpicture}[line cap=round,line join=round,>=triangle 45,x=1cm,y=1cm]
\begin{axis}[
x=1cm,y=1cm,
axis lines=middle,
ymajorgrids=true,
xmajorgrids=true,
xmin=-9.740000000000004,
xmax=9.74,
ymin=-6.62,
ymax=6.62,
xtick={-9,-8,...,9},
ytick={-6,-5,...,6},]
\clip(-9.74,-6.62) rectangle (9.74,6.62);
\draw[line width=2pt,dash pattern=on 1pt off 1pt,fill=black,fill opacity=0.25](-9.74,6.62)--(-9.74,-6.62)--(9.74,-6.62)--(9.74,-5.16)--(-7.93,6.62);
\draw [rotate around={0:(-1,0.5)},line width=2pt,dash pattern=on 1pt off 1pt,fill=black,fill opacity=0.25] (-1,0.5) ellipse (4.153311931459037cm and 4.153311931459037cm);
\draw[line width=2pt,dash pattern=on 1pt off 1pt,color=qqqqff,fill=qqqqff,fill opacity=0.25](9.74,0.82)--(-9.74,-1.9628571428571444)--(-9.74,-1.9628571428571444)--(-9.74,-6.62)--(9.74,-6.62)--(9.74,0.82);
\end{axis}
\end{tikzpicture}
\end{document}
Advantages of Using GeoGebra for LaTeX Figures
GeoGebra offers several advantages for generating figures in LaTeX documents:
1. Interactive Visualization:
GeoGebra allows users to create dynamic and interactive mathematical constructions, enabling readers to explore concepts and relationships directly within the document.
2. Ease of Use:
With its intuitive interface and user-friendly tools, GeoGebra makes it easy for users of all levels to create complex mathematical figures efficiently.
3. Versatility:
GeoGebra supports a wide range of mathematical topics, including geometry, algebra, calculus, statistics, and 3D modeling, making it suitable for various types of figures and illustrations.
4. Export Options:
GeoGebra provides seamless integration with LaTeX through its export feature, allowing users to export figures in TikZ format for direct inclusion in LaTeX documents.
5. Consistency:
By generating figures directly from GeoGebra, users can ensure consistency in style and formatting throughout their LaTeX documents, enhancing the overall coherence of the presentation.
Overall, leveraging GeoGebra for LaTeX figures enhances the quality, interactivity, and coherence of mathematical illustrations in academic and technical writing.
Advanced Techniques and Tips
Explore advanced techniques and tips to enhance your GeoGebra-generated LaTeX TikZ figures:
1. Animating Figures:
GeoGebra allows for the creation of animated figures. Incorporate animations into your LaTeX presentations or documents for dynamic and engaging mathematical illustrations.
2. Optimizing TikZ Code:
Optimize the TikZ code generated by GeoGebra for efficiency. Consider reducing file size and improving rendering speed by refining the exported code as needed.
By mastering these advanced techniques, you can elevate the visual impact of your mathematical illustrations in LaTeX documents.
Animating Figures
Animating figures in GeoGebra adds an interactive dimension to your mathematical illustrations. Below is an example of how to animate a simple geometric construction:
Create a triangle ABC using GeoGebra's drawing tools.
Construct the perpendicular bisectors of each side of the triangle to find the circumcenter.
As you animate the vertices of the triangle, observe how the circumcenter moves accordingly.
Export the animated figure to LaTeX TikZ format to seamlessly integrate it into your documents or presentations. Animations like this can enhance understanding and engagement with mathematical concepts.
Conclusion
Integrating GeoGebra with LaTeX TikZ provides a powerful solution for creating high-quality mathematical illustrations. By following the steps outlined in this guide, you can harness the dynamic capabilities of GeoGebra to generate precise figures and seamlessly incorporate them into your LaTeX documents.
From basic geometry constructions to advanced animations, GeoGebra offers a versatile toolkit for visualizing mathematical concepts. By exporting figures to LaTeX TikZ format, you ensure compatibility with LaTeX documents while maintaining the flexibility and interactivity of GeoGebra.
Empower your academic and technical writing with clear and compelling mathematical illustrations generated through GeoGebra and LaTeX TikZ, enhancing the clarity and impact of your work.
As you delve into the world of GeoGebra and LaTeX TikZ, I encourage you to continue exploring and experimenting with advanced features:
Explore more advanced features and techniques offered by GeoGebra, such as 3D modeling, scripting, and custom app development, to take your mathematical illustrations to the next level.
Connect with the GeoGebra and LaTeX communities to exchange ideas, seek advice, and share your own creations. Collaboration can provide valuable insights and inspiration for your projects.
Keep an open mind and embrace creativity as you experiment with different approaches to mathematical visualization. Don't be afraid to think outside the box and push the boundaries of traditional illustration methods.
By embracing curiosity and creativity, you'll unlock endless possibilities for creating captivating and informative mathematical illustrations with GeoGebra and LaTeX TikZ.
Additional Resources
Explore these additional resources to further enhance your skills in using GeoGebra and LaTeX TikZ:
1. GeoGebra Tutorials and Documentation:
Visit the official GeoGebra website for tutorials, documentation, and user guides to help you master the various features and functionalities of GeoGebra.
2. LaTeX Documentation and Forums:
Refer to LaTeX documentation and online forums such as Stack Exchange for LaTeX to find answers to specific questions, troubleshoot issues, and learn advanced LaTeX techniques.
3. Online Communities and Forums:
Join online communities and forums dedicated to GeoGebra and LaTeX to connect with other users, share tips and tricks, and stay updated on the latest developments in mathematical illustration.
Related Articles


Most Recent Articles


Most Viewed Articles


0 Comments, latest
No comments.