
Venn diagrams are an effective way of representing sets and their relationships. They are often used in mathematics, statistics, and computer science to visually depict the overlapping areas of different sets. If you are working on a project that requires a Venn diagram, LaTeX with TikZ is an excellent tool to use.
In this tutorial, I will walk you through the process of creating a Venn diagram using LaTeX with TikZ. TikZ is a powerful package for creating graphics in LaTeX, and it is perfect for creating complex figures like Venn diagrams.
Before we get started, make sure that you have a basic understanding of LaTeX and TikZ. I will assume that you know how to create a LaTeX document and how to use basic TikZ commands.
Step 1: Load the TikZ Package
The first step is to load the TikZ package. Add the following code to your LaTeX document’s preamble:
\documentclass{standalone}
\standaloneconfig{border=2mm 2mm 2mm 2mm}
\usepackage{pgfplots}
\pgfplotsset{compat=newest}
Step 2: Define the Sets
The next step is to define the sets that will be used in the Venn diagram. In this example, I will use three sets: A, B, and C. Add the following code to your document:
\begin{tikzpicture}
	% Define the circles
	\def\firstcircle{(0,0) circle (2cm)}
	\def\secondcircle{(60:2cm) circle (2cm)}
	\def\thirdcircle{(0:2cm) circle (2cm)}
	% Draw the circles
	\draw \firstcircle;
	\draw \secondcircle;
	\draw \thirdcircle;
\end{tikzpicture}
This code defines three circles, each with a radius of 2cm. The \def command defines a macro that can be used later in the code to draw the circles. The circles are named \firstcircle, \secondcircle, and \thirdcircle, and they are drawn using the \draw command.
Then we draw the nodes. The node command is used to add text to the Venn diagram. The text is added inside curly braces, and the location of the node is specified in square brackets by combining the parametersabove, below, left and right, you can also use at (x,y) to draw the node at the exact coordinates.
% Add the labels
\draw (-2.5,0) node at (-1,-1) {$A$};
\draw (1,2.5) node[above] {$B$};
\draw (1,-2.5) node at (2.5,-1) {$C$};
\draw (-0.1,1.4) node[rotate=20] {$A \cap B \setminus C$};
\draw (1.3,1.5) node[rotate=20] {$B \cap C$};
\draw (0.6,-0.3) node[rotate=45] {$A \cap C$};
\draw (1,0.5) node {$A \cap B \cap C$};
Step 3: Add the Overlapping Areas
The next step is to add the overlapping areas between the sets. To do this, we will use the scope and \clip commands to define the area that will be filled with color. The \fill command is used to fill the area with the specified color. Like so:
% Fill the intersections
\begin{scope}
  \clip \firstcircle;
  \fill[red,opacity=0.5] \secondcircle;
\end{scope}
The whole thing put together :
\documentclass{standalone}
\standaloneconfig{border=2mm 2mm 2mm 2mm}
\usepackage{pgfplots}
\pgfplotsset{compat=newest}

\begin{document}
\begin{tikzpicture}

% Define the circles
\def\firstcircle{(0,0) circle (2cm)}
\def\secondcircle{(60:2cm) circle (2cm)}
\def\thirdcircle{(0:2cm) circle (2cm)}

% Draw the rectangle
\draw[dashed] (-3,-2.5) rectangle (4.5,4.5) node at (-2.5,4) {$E$};

% Draw the circles
\draw \firstcircle;
\draw \secondcircle;
\draw \thirdcircle;

% Fill the intersections
\begin{scope}
  \clip \firstcircle;
  \fill[red,opacity=0.5] \secondcircle;
\end{scope}

\begin{scope}
  \clip \firstcircle;
  \fill[green,opacity=0.5] \thirdcircle;
\end{scope}

\begin{scope}
  \clip \secondcircle;
  \fill[blue,opacity=0.5] \thirdcircle;
\end{scope}


% Add the labels
\draw (-2.5,0) node at (-1,-1) {$A$};
\draw (1,2.5) node[above] {$B$};
\draw (1,-2.5) node at (2.5,-1) {$C$};
\draw (-0.1,1.4) node[rotate=20] {$A \cap B \setminus C$};
\draw (1.3,1.5) node[rotate=20] {$B \cap C$};
\draw (0.6,-0.3) node[rotate=45] {$A \cap C$};
\draw (1,0.5) node {$A \cap B \cap C$};

\end{tikzpicture}

\end{document}
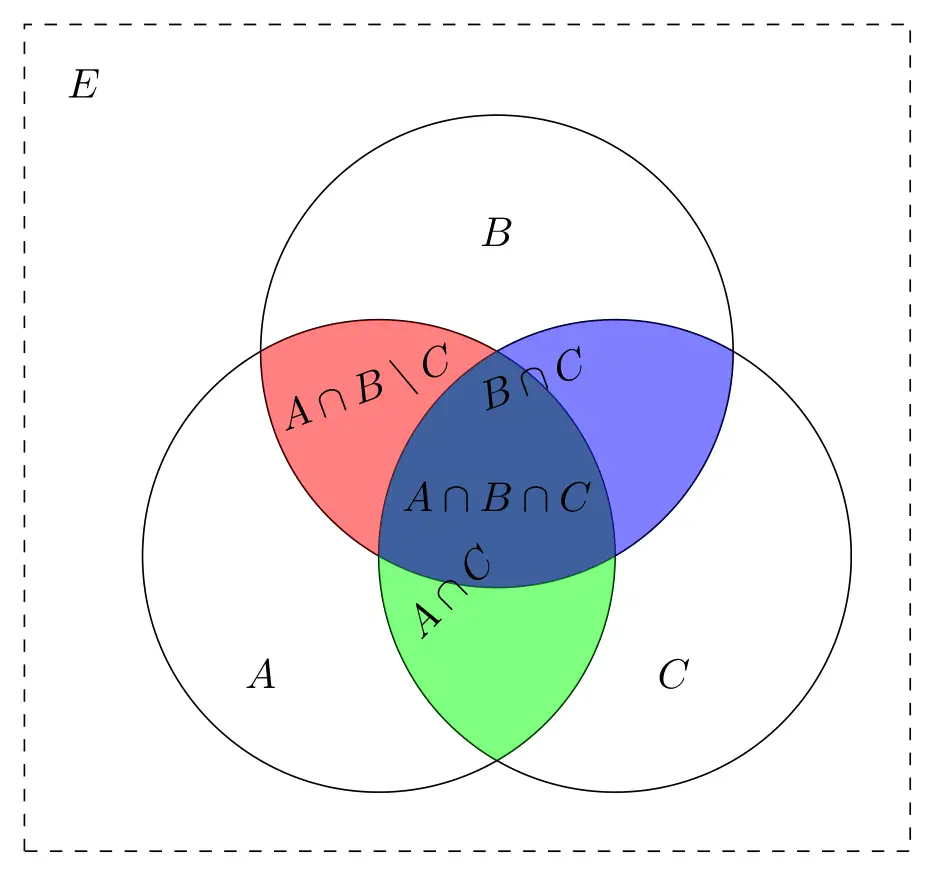
And there you are, you can start making Venn Diagrams easily and add them to your documents
Related Articles


Most Recent Articles


Most Viewed Articles


0 Comments, latest
No comments.