How to Create a Database Illustration with Tikz in Latex
Category: Latex
Date: April 2023
Views: 1.54K
Latex is a versatile typesetting language, with it you can create stunning documents and illustrations with ease. In this article, I will show you just how easy it is to create a database illustration showing the tables and their relationships using the Tikz package.
As always, if you're a regular reader of this corner of my website, you'll know that I start by presenting the Latex document preamble. So let's get started by opening a new Latex document and adding the necessary packages and configuration settings:
\documentclass{standalone}
\standaloneconfig{border=2mm}
\usepackage{tikz}
\usetikzlibrary{positioning,shapes}

\begin{document}

\begin{tikzpicture}[node distance=3cm, every node/.style={font=\sffamily}]
In this tutorial, we will create a database diagram using Tikz package. Tikz is a powerful tool that allows you to create high-quality graphics and illustrations. It is widely used for creating technical and scientific illustrations, flowcharts, and diagrams.
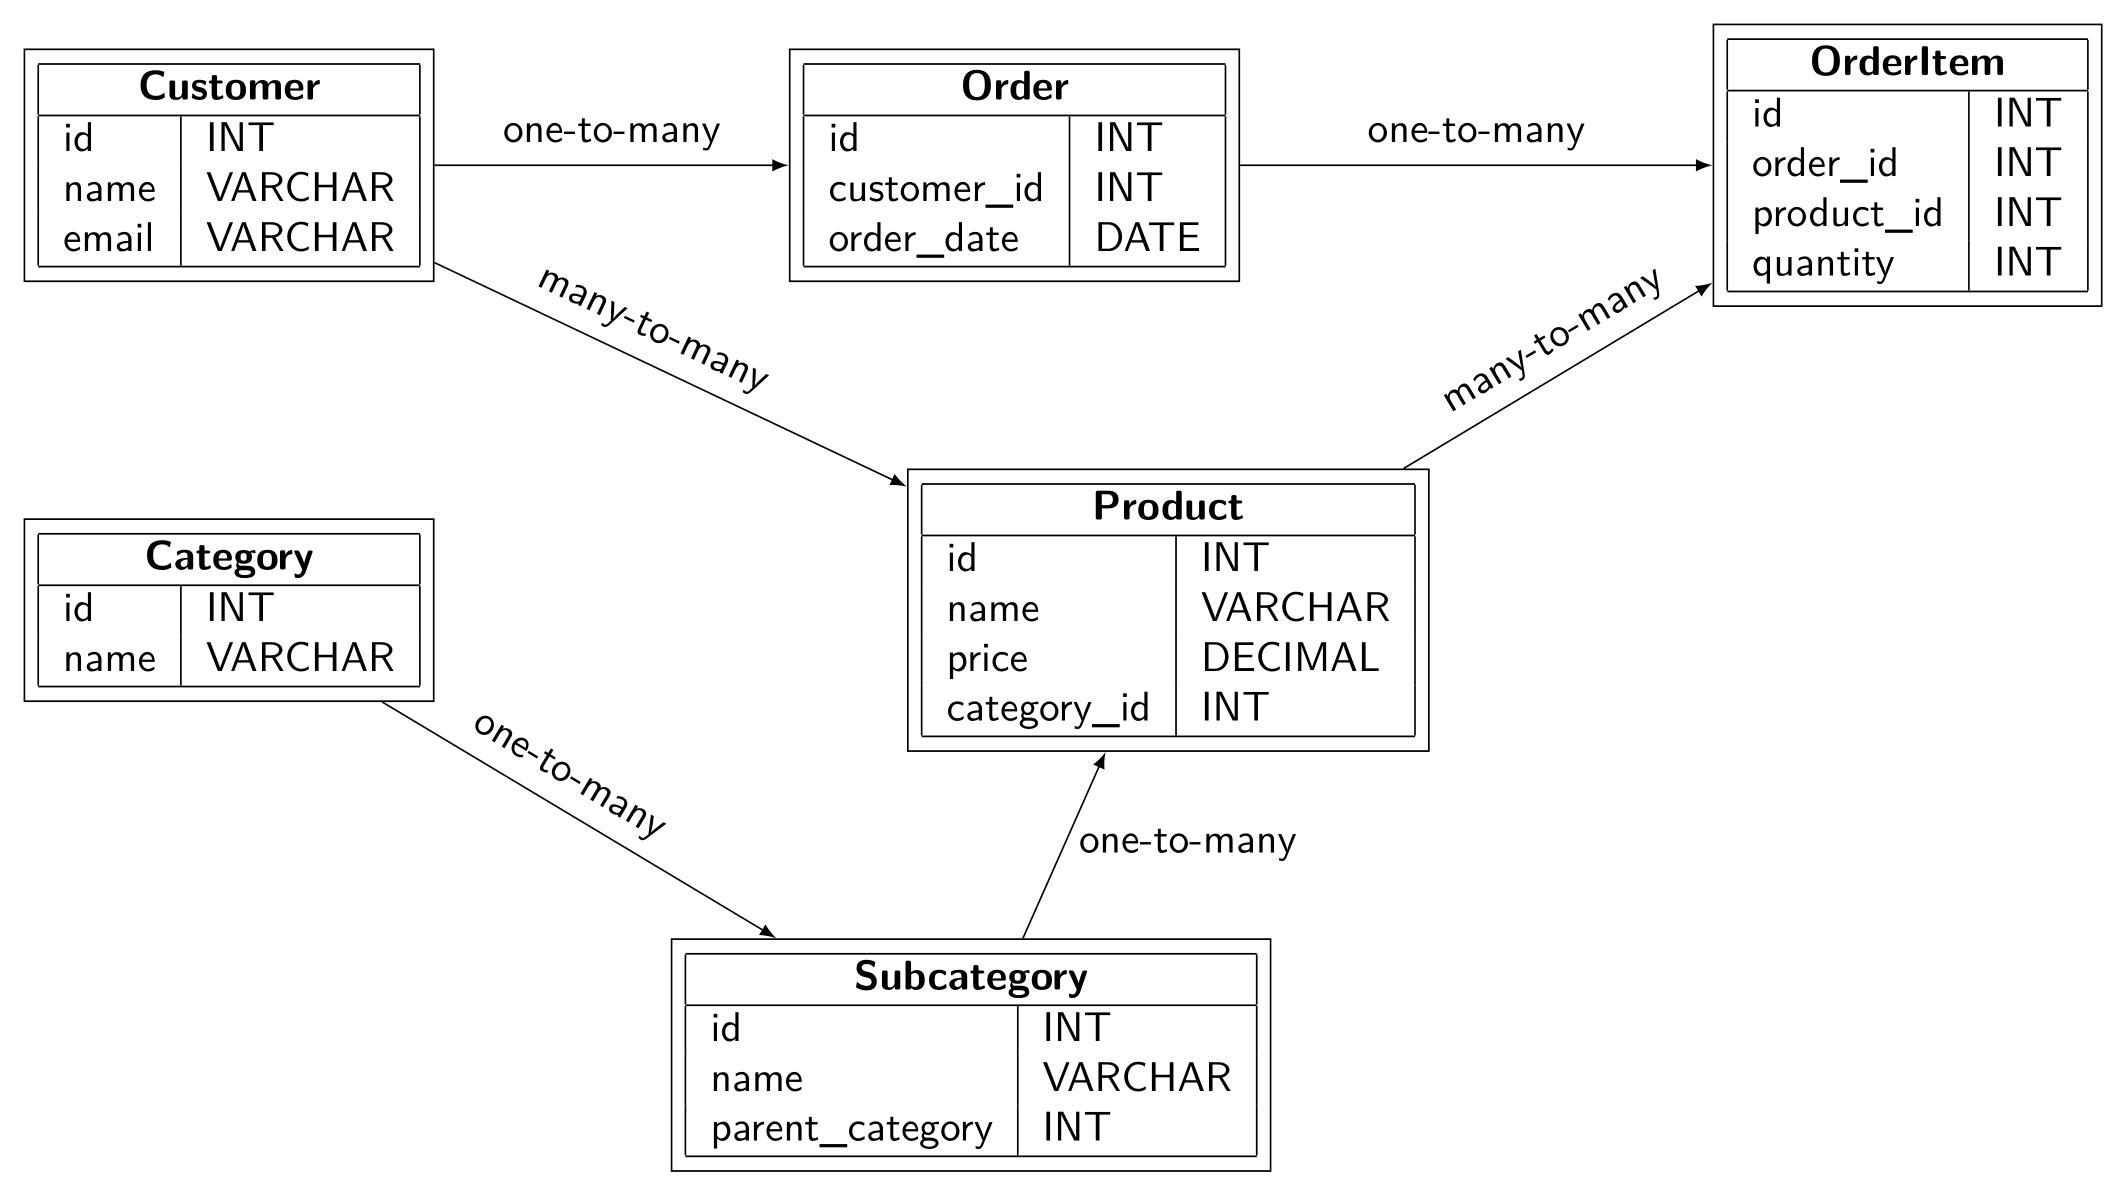
A relational database is a group of tables with relationships between them. Each table represents an entity or object, and the relationships between the tables define how the objects are related to each other. We will use Tikz to create a visual representation of a database that shows the tables and their relationships.
To start, let's define the tables that we will be using in our database. For this tutorial, we will be using six tables: "customer", "order", "orderitem", "product", "category", and "subcategory".
Now that we have defined our tables, we can start creating our database diagram. We will use Tikz to create the tables and the relationships between them. Tikz allows us to position elements precisely on the page and create complex diagrams with ease. Each one of these tables is a \node defined using the following syntax: `\node[positioning and other styles] (name) { body of the node }` like this:
% Draw the Customer table node
  \node[rectangle, draw] (customer) {
    \begin{tabular}{|l|l|}
      \hline
      \multicolumn{2}{|c|}{\textbf{Customer}} \\
      \hline
      id & INT \\
      name & VARCHAR \\
      email & VARCHAR \\
      \hline
    \end{tabular}
  };
  % Draw the category table node
  \node[rectangle, draw, below=2cm of customer] (category) {
    \begin{tabular}{|l|l|}
      \hline
      \multicolumn{2}{|c|}{\textbf{Category}} \\
      \hline
      id & INT \\
      name & VARCHAR \\
      \hline
    \end{tabular}
  };
We will position the tables using the "positioning" Tikz library, which allows us to position nodes relative to other nodes. with any combination of the anchors : above, below, left and right. even complex combinations like: `below=5cm of order, right=4cm of category` or `below right=2cm and 2cm of category`
Next we draw the relationships (lines) between the tables:
% Draw the relationships between the tables
\draw[-latex] (customer) -- node[above]{one-to-many} (order);
\draw[-latex] (order) -- node[above]{one-to-many} (orderitem);
\draw[-latex] (product) -- node[above right,sloped,pos=0.15]{many-to-many} (orderitem);
\draw[-latex] (customer) -- node[above left,sloped,pos=0.7]{many-to-many} (product);
\draw[-latex] (category) -- node[above left,sloped,pos=0.7]{one-to-many} (subcategory);
\draw[-latex] (subcategory) -- node[right]{one-to-many} (product);

Stay tuned for the next tutorial. Until then happy Latexing.
Related Articles


Most Recent Articles


Most Viewed Articles


0 Comments, latest
No comments.