How to Draw Vertical Asymptotes Using LaTeX TikZ: A Step-by-Step Guide
Category: Latex
Date: April 2023
Views: 982
Drawing vertical asymptotes using LaTeX TikZ is a handy skill to have in your arsenal when you want to illustrate the behavior of a function near a particular x-value. With just a few lines of code, you can create a clear and concise visual representation of a function's vertical asymptotes that will help your audience understand the function's behavior better.
So, how do you draw vertical asymptotes in TikZ? Well, it's easier than you might think. First, let's take a look at what a vertical asymptote is.
A vertical asymptote is a line that a function approaches but never touches as the input approaches a certain value. This means that the function's output approaches infinity or negative infinity as the input approaches the vertical asymptote.
To draw a vertical asymptote in TikZ, you need to plot the function first and then define the domain in which the function is valid using the restrict y to domain option. You also need to tell TikZ how to handle points where the function is undefined using the unbounded coords option.
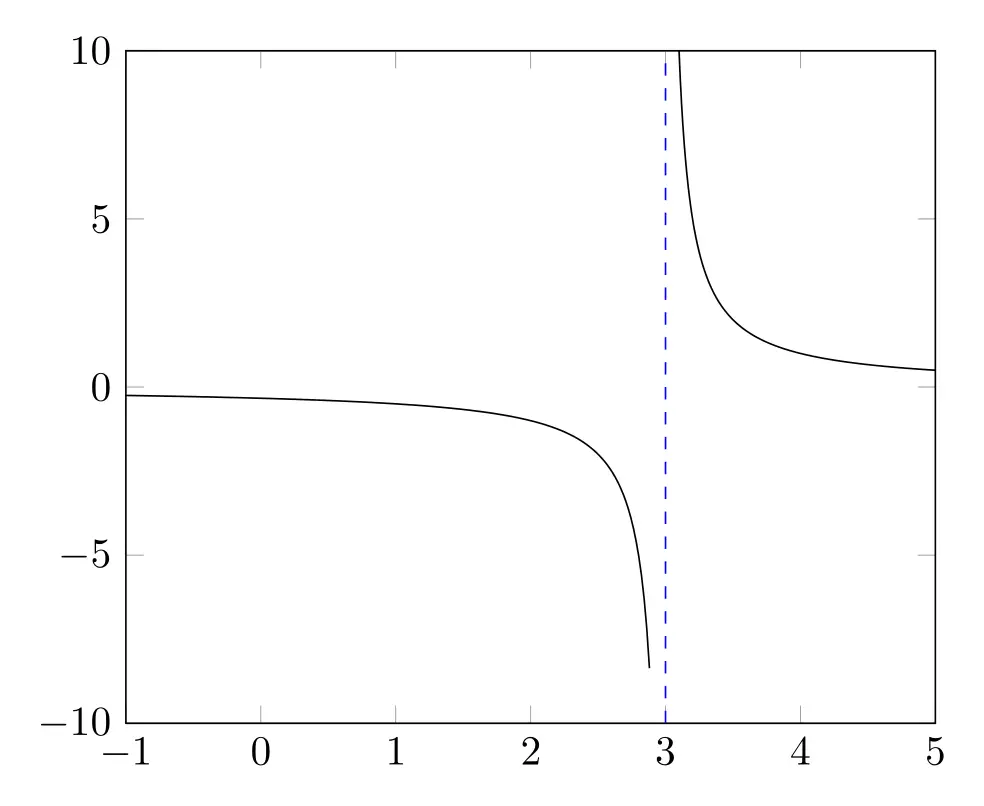
Here's an example to illustrate the process. Let's say we want to draw a vertical asymptote at x=3 for the function f(x) = 1/(x-3). We can use the following code:
\begin{tikzpicture}
	\begin{axis}[xmin=-1,xmax=5,ymin=-10,ymax=10,restrict y to domain=-10:10,unbounded coords=jump]
	\addplot[domain=-1:2.9,samples=200]{1/(x-3)};
	\addplot[domain=3.1:5,samples=200]{1/(x-3)};
	\draw[dashed] (3,-10) -- (3,10);
	\end{axis}
\end{tikzpicture}
In this code, we first set the x and y limits of the plot using xmin, xmax, ymin, and ymax. We then use restrict y to domain=-10:10 to tell TikZ to only plot the function where the y values are between -10 and 10. The unbounded coords=jump option tells TikZ to ignore points where the function is undefined (in this case, when x=3).
Next, we plot the function in two separate parts using the domain and samples options. We do this to avoid drawing the vertical asymptote.
Finally, we draw the dashed vertical line at x=3 using the \draw[dashed] (3,-10) -- (3,10); command.
And that's it! With this code, we have successfully drawn a vertical asymptote at x=3 for the function f(x) = 1/(x-3). The above code will produce the follwoing figure:
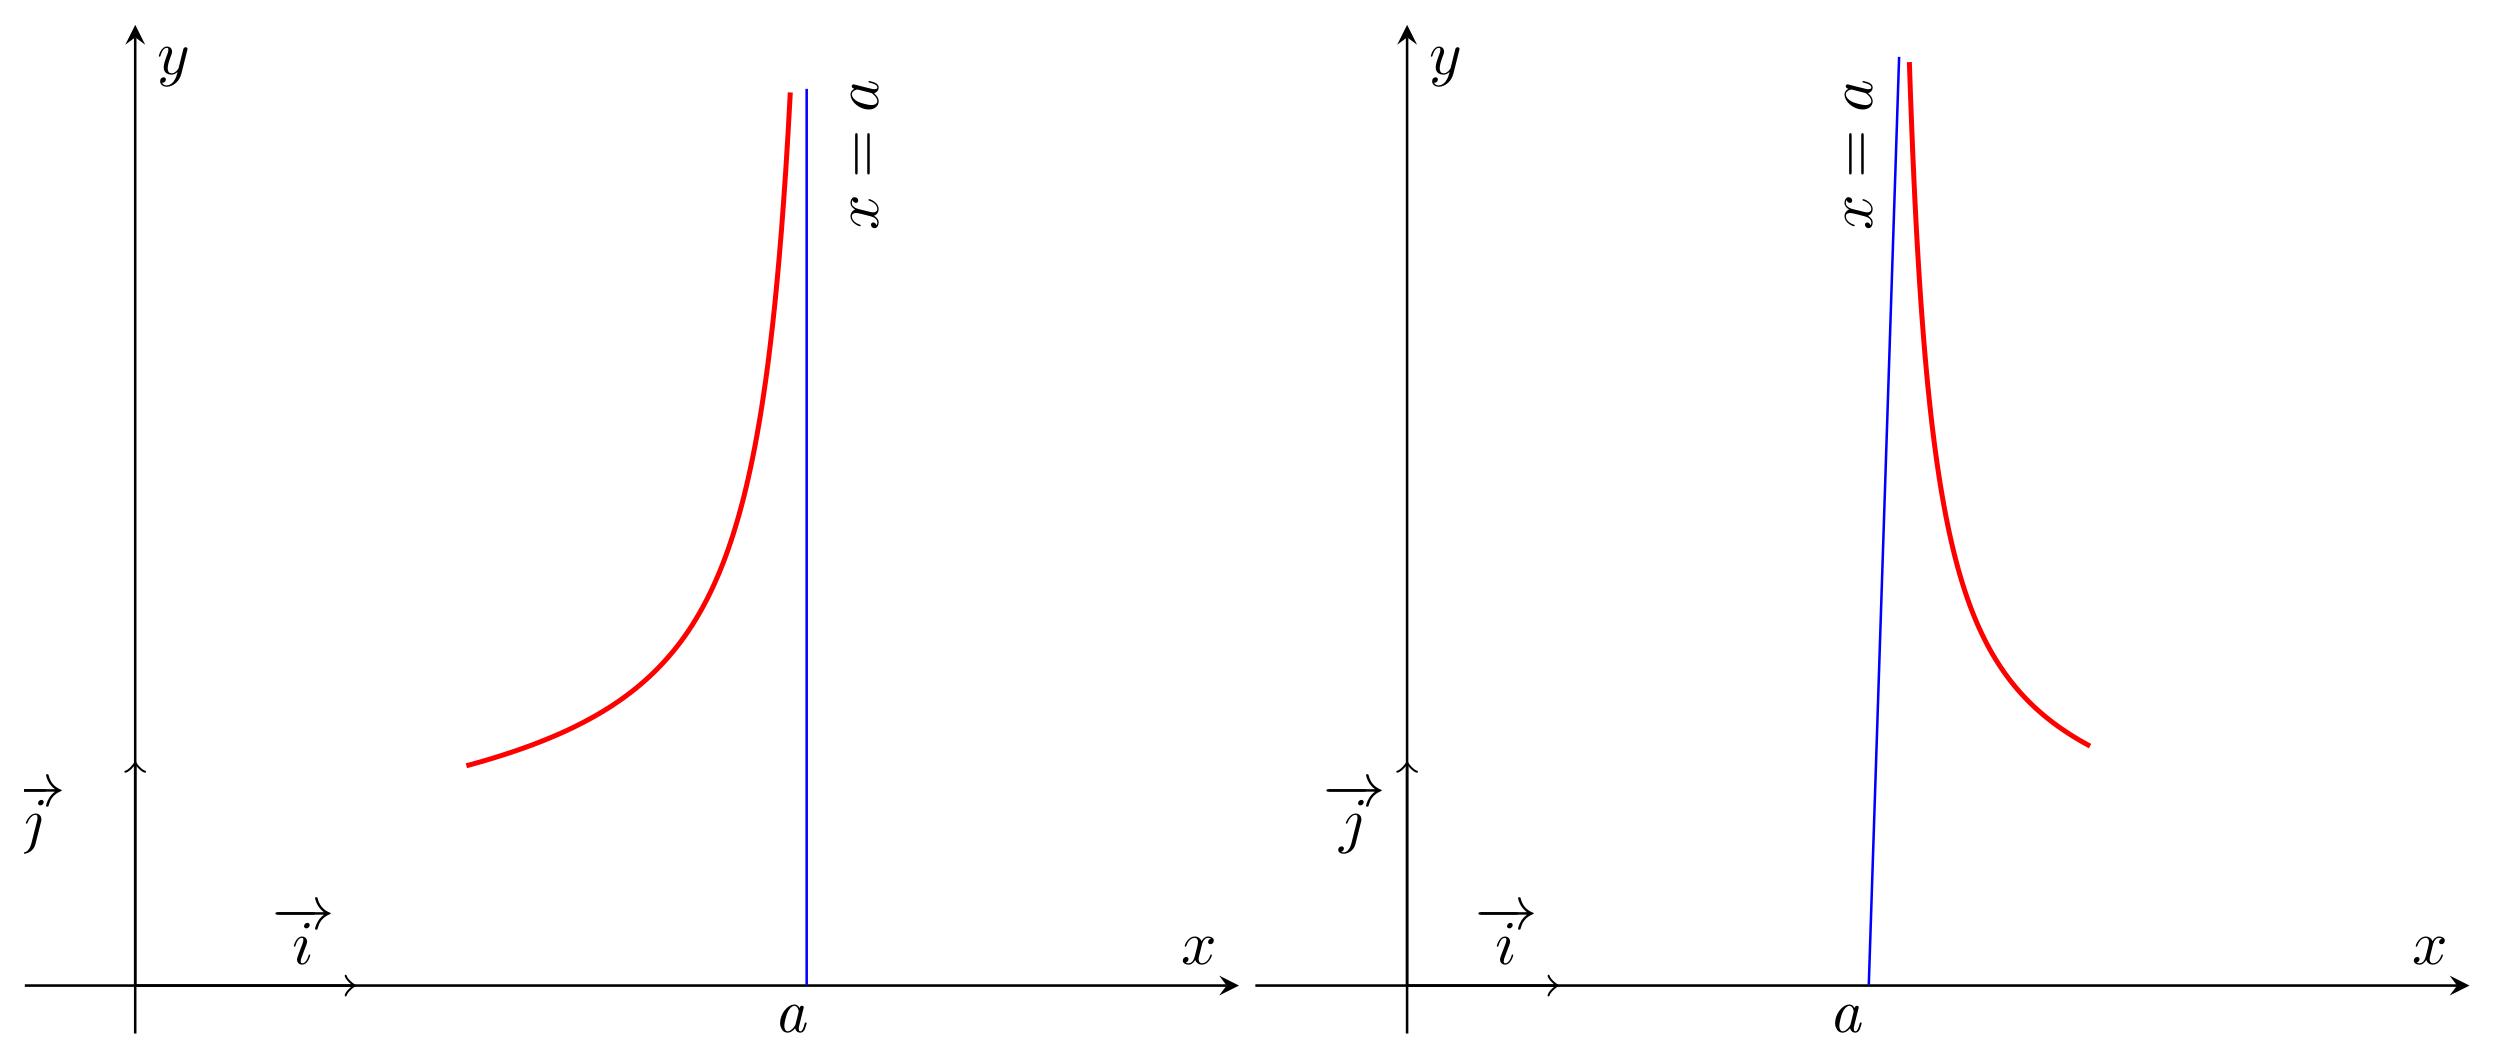
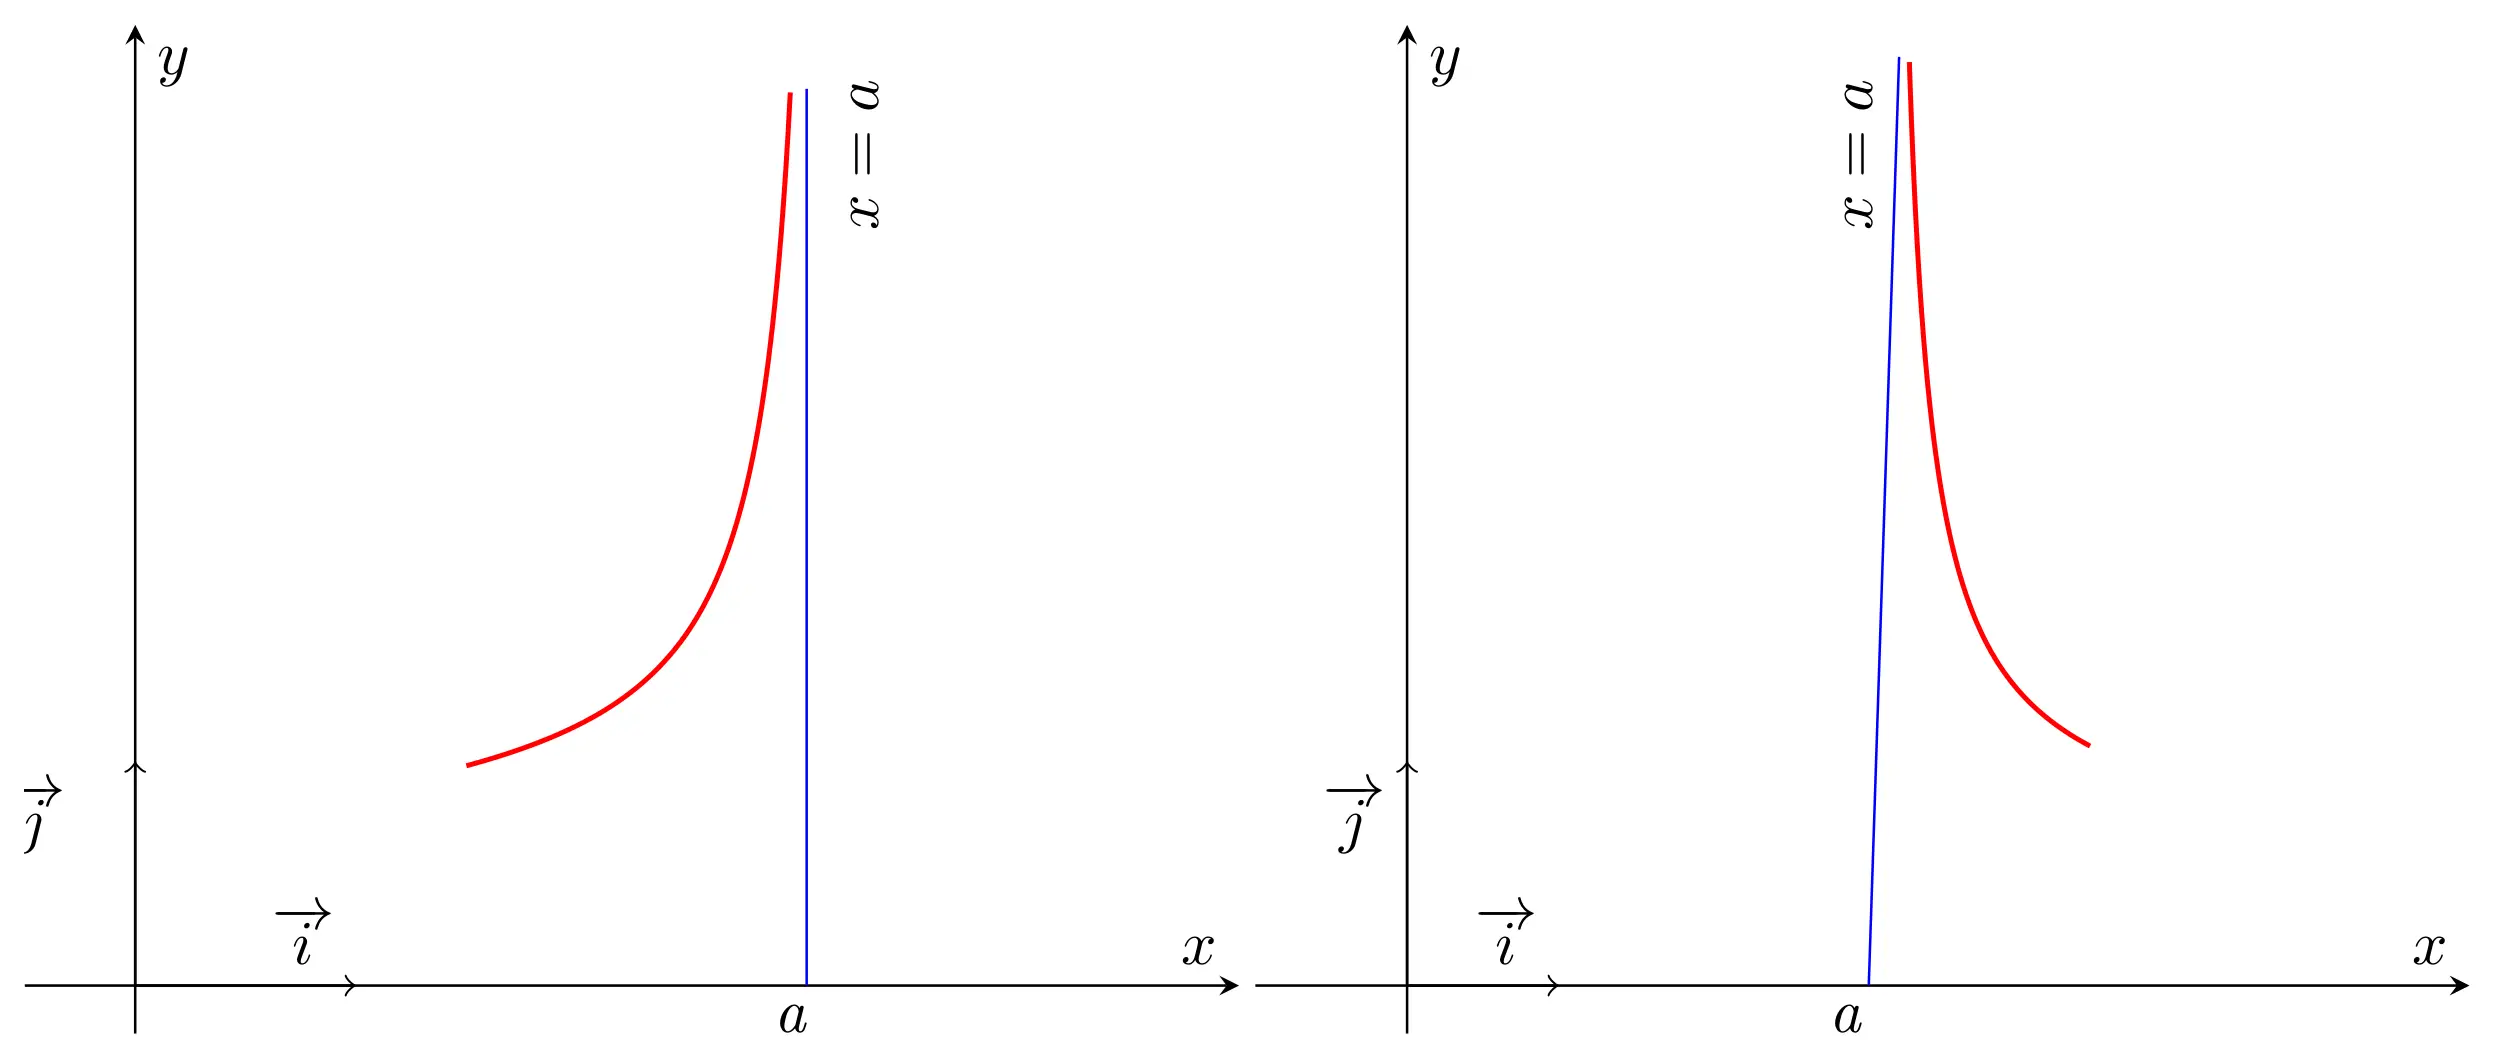
here is an additional Latex code with more settings and customizations :
\documentclass{standalone}
\standaloneconfig{border=2mm 2mm 2mm 2mm}
\usepackage{pgfplots}
\pgfplotsset{compat=1.18}
\begin{document}
\begin{tikzpicture}[scale=1.00]
    \begin{axis}[axis lines=center,
		xlabel={$x$},
		ylabel={$y$},
		xtick=\empty,ytick=\empty,
		xmin=-0.5,xmax=5,
		ymin=-1.5,ymax=30,
		restrict y to domain=0.01:29,
		unbounded coords=jump,
		samples=200]
	\addplot [red,thick,domain=1.5:3.5,restrict y to domain=0.01:29,unbounded coords=jump]
		{5+ 2*tan(deg(x/2))};
	\addplot [blue,unbounded coords=jump] coordinates {(pi-0.1,0.01) (pi-0.1,28)};
	\draw[->] (0,0) -- (1,0) node[above left] {\textit{$\overrightarrow{i}$}};
	\draw[->] (0,0) -- (0,7);
	\node[anchor=north west] at (-0.7,7) {\textit{$\overrightarrow{j}$}};
	\node[below left] at (pi,0.1) {\textit{a}};
	\node[rotate=90,anchor=north east] at (pi,29) {$x=a$};
     \end{axis}
\end{tikzpicture}


\begin{tikzpicture}[scale=1.00]
	\begin{axis}[axis lines=center,
		xlabel={$x$},
		ylabel={$y$},
		xtick=\empty,ytick=\empty,
		xmin=-1,xmax=7,
		ymin=-1.5,ymax=30,
		restrict y to domain=0.01:29,
		unbounded coords=jump,
		samples=200]
		\addplot [red,thick,domain=3:4.5,restrict y to domain=0.01:29,
			unbounded coords=jump] {5-2*tan(deg(x/2))};

		\addplot [blue,unbounded coords=jump] coordinates {(pi-0.1,0.01) (pi+0.1,29)};
		\draw[->] (0,0) -- (1,0) node[above left] {\textit{$\overrightarrow{i}$}};
		\draw[->] (0,0) -- (0,7);
		\node[anchor=north west] at (-0.7,7) {\textit{$\overrightarrow{j}$}};
		\node[below left] at (pi,0.1) {\textit{a}};
		\node[rotate=90,anchor=north east] at (pi-0.4,29) {$x=a$};
	\end{axis}
\end{tikzpicture}


\end{document}
The above two tikzpicture will produce the following :
Now, a word of caution: when drawing vertical asymptotes, it's essential to make sure that you define the domain of the function carefully. If you don't restrict the domain, TikZ will try to plot the function outside of its valid range, which can cause errors or infinite loops. It's also a good idea to use unbounded coords=jump to tell TikZ to ignore points where the function is undefined.
In conclusion, drawing vertical asymptotes in LaTeX TikZ is a useful skill that can help you create clear and concise visual representations of a function's behavior. With just a few lines of code, you can create impressive visuals that will help your audience understand complex concepts easily. So, give it a try!
Related Articles


Most Recent Articles


Most Viewed Articles


0 Comments, latest
No comments.