Scatter Plot with Data From csv File
📅 May 06, 2024 | 👁️ Views: 90
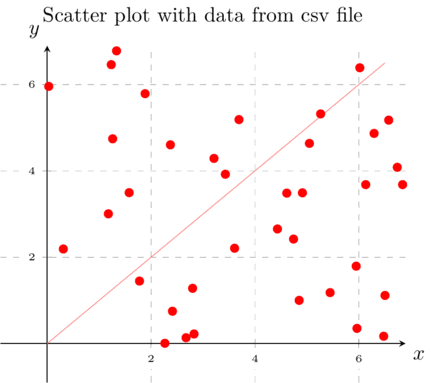
\documentclass{standalone}
\usepackage{pgfplots}
\pgfplotsset{compat=newest}

\begin{document}

\begin{tikzpicture}
  \begin{axis}[
      xlabel={ $x$},
      ylabel={ $y$},
      xmin=0, xmax=6,
      ymin=0, ymax=6,
      title={Scatter plot with data from csv file},
      enlargelimits,
      axis x line=middle,
      axis y line=middle,
      enlarge x limits=0.15,
      enlarge y limits=0.15,
      grid=both,
      grid style={dashed,thin},
      ticklabel style={font=\tiny, fill=white},
      title style={at={({0.5,1.1})},anchor=north},
      every axis x label/.style={
        at={(current axis.right of origin)},
        anchor=north west
      },
      every axis y label/.style={
        at={(current axis.above origin) },
        anchor=south east
      }
    ]

    \addplot[red, only marks] table[col sep=comma] {data.csv};
    \addplot[red!45!, smooth, domain=0:6.5] {x};
  \end{axis}
\end{tikzpicture}

\end{document}
And The data.csv file :
0.3108250741372154,2.1906345524886452
6.362843591974903,7.642093997828474
6.3760247724108154,9.029747427654584
9.722495288021936,8.193266466290583
9.807551796483606,1.3131458956236652
2.010299025028923,9.194748627752979
4.2421175590333124,7.143234761825223
1.1782201877798126,3.005445248422772
4.61286324494722,3.4846326134524985
8.277016564035767,8.410318834693419
8.040305580372817,4.743606633539419
2.827540182047421,0.22174629028063664
5.06223190697014,8.655567081996685
5.446581098299442,1.1798591791184276
2.4942599320055834,8.353143780896273
2.1915833545122654,7.230702174261603
2.372246271481325,4.6037237176181875
9.487722458011596,2.8227038355933045
5.948494211564393,1.7932572403247715
1.2339013064238669,6.461718171234886
1.8855998063102108,5.789129880401992
4.850993468858322,1.000470272031746
0.030342525681715804,5.958011728717992
2.7993635600979982,1.2797275306527778
6.1321128077686025,3.6820326534456993
6.841808737357413,3.6818850113951096
6.223258437895271,7.718400587420799
4.432656991741906,2.65493036203319
8.065876640402621,0.04376467919264826
8.020437226388713,2.2712433631985363
7.800722127349484,1.8031389932644593
0.8279048333860695,8.50964670071028
6.36085422500887,7.544248013525264
8.458213567606677,2.005205209298453
9.305877253175822,5.458496687091613
8.300421398154093,8.080282942443425
7.8524003210950175,3.2167409006428094
9.213115007405586,6.41453940226052
9.298143942753322,1.002566180959864
6.966487273397036,7.693985414993309
2.5070390431740797,8.584345340875124
7.8537785762538235,7.335250427796512
9.443339592211451,6.733206622157056
6.3504857066548865,9.244833959547833
3.2823368489130966,8.018231904424027
9.531985005186309,9.328328676528908
8.703613165332088,5.735302293021851
8.151826306950328,7.789033911197475
7.505987313986551,6.716685251538374
3.6073768423775086,2.2082899902294217
4.289467584456419,7.3241122102846825
2.6737692112476275,0.1348273216712903
5.0482006845658205,4.637156653111197
1.2608738880321813,4.743576432302597
7.930272025807677,3.003163908826699
1.007134105300428,8.006966355182698
6.018062943531504,6.389625565649615
3.2107368932832814,4.2891772893103886
8.392508572914707,2.268821573611194
7.948932595733961,7.560405567971989
6.739110778694109,4.083467075553525
6.292988228644245,4.868211918020996
7.522013529521967,6.790079075676662
9.965688499177826,3.784527900931236
4.2753870443611905,9.965175388990225
9.820805232197758,6.251574403602495
2.9254077883967247,7.623783697159324
6.835268219935705,9.39651266331857
9.921155147249287,2.5812022443716556
6.477815248414833,0.16926654059933877
6.503671378832371,1.1149286165690286
1.578553334029097,3.496228333261283
3.4303145202215193,3.922863923039104
9.553411459164286,0.44136762361147164
1.3352423890201293,6.780988790277931
3.191619480598594,8.073389272847155
5.963723932350691,0.3516922218902563
0.24198940566299565,7.187717581385656
3.6922604268429273,5.1883995963618235
7.730186678088751,1.4226312258176854
7.033048796432606,0.5893997995354094
9.872421983351353,7.2378502111552825
3.111750838056543,7.48372002025846
9.791343505705793,0.08524610075462236
2.2658655076229217,0.006066938389844845
7.750462435351018,7.621921923638536
2.4115556782001137,0.7486728331870074
6.574695687287361,5.175826814768203
4.742528892555743,2.4206386745417174
9.088144433909987,0.7547298899317911
5.6309404771042795,8.500679944111372
0.17741415569774377,9.402885561300142
2.650448051929435,9.31487472289856
4.913746001214837,3.4924777161907397
1.7774754231440992,1.448164011303129
7.420592804479251,9.677174253484571
5.264047922366086,5.320444829854475
8.270743919604065,1.160419551346209
9.341652878130926,3.9988855026100865
2.8456517522253213,7.544137306519493
Related Courses, Exams, and Exercises
Course PDF:
📥 Download Scatter Plot with Data From csv File (PDF)
if you find this content helpful, Please consider supporting me with a small donation
إن وجدت هذا المحتوى مفيدا، من فضلك إدعمني بمبلغ بسيط كتبرع
Buy me a coffee — إشتر لي قهوة
PayPal.me • عبر بايبالOr bank transfer • أو حوالة بنكية
Titulaire : RADOUAN MOSAID
RIB : 230 090 6501953211022000 65
IBAN : MA64 2300 9065 0195 3211 0220 0065
BIC / SWIFT : CIHMMAMC
