
Create a PowerPoint Presentation in Minutes with Python
How to Create a PowerPoint Presentation Using Python
Have you ever needed to create a presentation but lacked access to office software or simply didn’t have the time to design it manually? With Python and the python-pptx library, you can automate the process, creating professional-looking presentations with ease. In this tutorial, I’ll walk you through creating a PowerPoint presentation, including adding text, formatting slides, and incorporating figures generated using Python.
1. Setting Up Your Environment
To get started, install the necessary libraries:
pip install python-pptx matplotlib
The python-pptx library will handle creating and formatting the presentation, while matplotlib is used for generating images and graphs.
2. Creating a Basic Presentation
Start by creating a new PowerPoint file:
from pptx import Presentation

# Create a new presentation
prs = Presentation()

# Save the presentation
prs.save('my_presentation.pptx')
This creates an empty PowerPoint file named my_presentation.pptx.
3. Adding Slides and Text
To add a title slide with text:
# Add a title slide
slide = prs.slides.add_slide(prs.slide_layouts[0])

# Set the title and subtitle
title = slide.shapes.title
subtitle = slide.placeholders[1]

title.text = "Welcome to Python-Powered Presentations"
subtitle.text = "Automate your PowerPoint creation!"
4. Formatting Text
You can customize the appearance of the text, such as font size and color:
from pptx.util import Pt
from pptx.dml.color import RGBColor

# Format the title
title.text_frame.text = "Python Power"
title_format = title.text_frame.paragraphs[0]
title_format.font.size = Pt(36)
title_format.font.bold = True
title_format.font.color.rgb = RGBColor(255, 0, 0)  # Red
5. Adding Figures
Generate and include figures using matplotlib:
import matplotlib.pyplot as plt

# Create a sample plot
plt.figure(figsize=(6, 4))
plt.plot([1, 2, 3], [4, 5, 6], label="Sample Line")
plt.xlabel("X-Axis")
plt.ylabel("Y-Axis")
plt.title("Sample Plot")
plt.legend()

# Save the figure
plt.savefig('sample_plot.png')

# Add the image to a slide
image_slide = prs.slides.add_slide(prs.slide_layouts[5])  # Blank layout
image_slide.shapes.add_picture('sample_plot.png', Pt(100), Pt(100), width=Pt(400), height=Pt(300))
6. Saving the Presentation
Once you’ve added content, save the presentation:
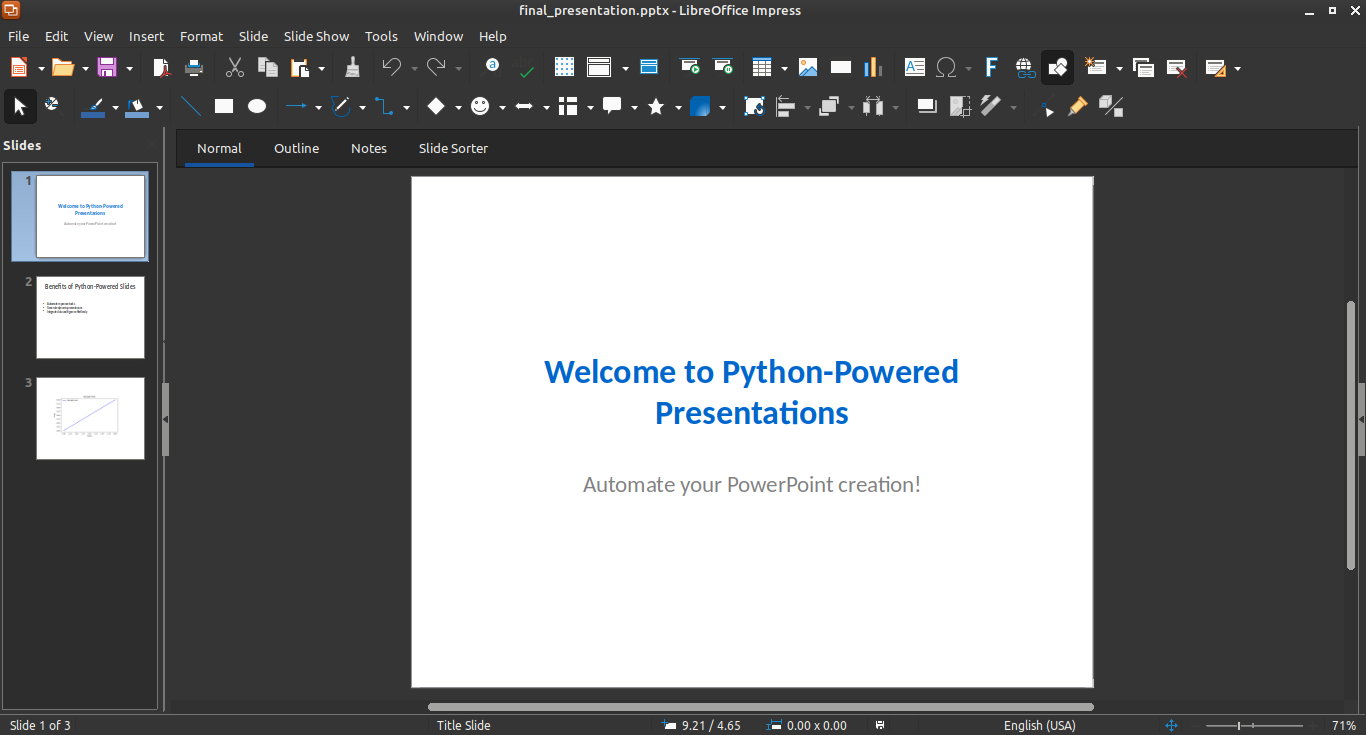
prs.save('final_presentation.pptx')
Here is the full python script, you can easily extend it with more slides
from pptx import Presentation
from pptx.util import Pt
from pptx.dml.color import RGBColor
import matplotlib.pyplot as plt

# Create a new PowerPoint presentation
prs = Presentation()

# 1. Add a title slide
slide = prs.slides.add_slide(prs.slide_layouts[0])
title = slide.shapes.title
subtitle = slide.placeholders[1]
title.text = "Welcome to Python-Powered Presentations"
subtitle.text = "Automate your PowerPoint creation!"

# Format the title text
title_format = title.text_frame.paragraphs[0]
title_format.font.size = Pt(36)
title_format.font.bold = True
title_format.font.color.rgb = RGBColor(0, 102, 204)  # Blue color

# Format the subtitle text
subtitle_format = subtitle.text_frame.paragraphs[0]
subtitle_format.font.size = Pt(24)
subtitle_format.font.color.rgb = RGBColor(128, 128, 128)  # Gray color

# 2. Add a content slide
content_slide = prs.slides.add_slide(prs.slide_layouts[1])
content_title = content_slide.shapes.title
content_title.text = "Benefits of Python-Powered Slides"

# Add bullet points
bullet_points = [
    "Automate repetitive tasks",
    "Generate dynamic presentations",
    "Integrate data and figures effortlessly"
]
content = content_slide.placeholders[1]
for point in bullet_points:
    paragraph = content.text_frame.add_paragraph()
    paragraph.text = point
    paragraph.level = 0  # Top-level bullet point
    paragraph.font.size = Pt(18)
    paragraph.font.color.rgb = RGBColor(0, 0, 0)  # Black color

# 3. Generate a figure with matplotlib
plt.figure(figsize=(6, 4))
plt.plot([1, 2, 3], [4, 5, 6], label="Sample Line", color="blue")
plt.xlabel("X-Axis")
plt.ylabel("Y-Axis")
plt.title("Sample Plot")
plt.legend()
figure_path = "sample_plot.png"
plt.savefig(figure_path)
plt.close()

# 4. Add the figure to a new slide
image_slide = prs.slides.add_slide(prs.slide_layouts[5])  # Blank slide layout
image_slide.shapes.add_picture(figure_path, Pt(100), Pt(100), width=Pt(500), height=Pt(300))

# 5. Save the presentation
output_file = "final_presentation.pptx"
prs.save(output_file)
print(f"Presentation saved as {output_file}")
Conclusion
With just a few lines of Python code, you can create fully customized PowerPoint presentations. This approach is perfect for generating slides dynamically, especially when dealing with large datasets or repetitive tasks.
Recent Articles


Boosting LaTeX Editing with Custom Vim Mappings
23 Nov 2025


Most Viewed Articles


The Ultimate Vim Setup (My 2024 vimrc ) : Essential Commands, Configurations, and Plugin Tips
Views: 1.11K
12 Apr 2024

Complete Tutorial: Creating Categories and Subcategories Using Pages in Pelican
Views: 880
24 Jun 2025